Get certified for free when you join Fabric Data Days 2026 and dive into Fabric, Power BI, SQL, AI, and other essential data skills.
Join nowJuly 28 - August 9 | Final Round of the Power BI Dataviz World Championships. This is your chance. Learn more
Happy holidays everyone! Need help on transforming this data that comes from the client tool as follows :
| Name | 1.1 | 1.1 Score | 1.2 | 1.2 Score | 2.1 | 2.2 Score |
| Name 1 | Attendance | 100% | Quality | 85% | Adherence | 60% |
| Name 2 | Attendance | 50% | Productivity | 0% | SLA | 75% |
The output I am trying to achieve would be :
| Name | Attribute | Score |
| Name 1 | Attendance | 100% |
| Name 1 | Quality | 85% |
| Name 1 | Adherence | 60% |
| Name 2 | Attendance | 50% |
| Name 2 | Productivity | 0% |
| Name 2 | SLA | 75% |
Tried unpivoting columns/unpivoting other columns one column at a time and also simultaneously but I'm not getting the desired result. To add context, I am required to create a visual to show the count of 0% score instances per attribute/metric.
Any solution would be a huge help 🙇
Solved! Go to Solution.
let
Source = Table.FromRows(Json.Document(Binary.Decompress(Binary.FromText("i45W8kvMTVUwVNJRciwpSc1LScxLTgVyDA0MdAwMVIGswNLEnMySSiDLwhQq5JiSkVqUClFoBlEXqwM1yQjdJFOYQQFF+SmlySWZZRDTYMLBPo5A0hxidmwsAA==", BinaryEncoding.Base64), Compression.Deflate)), let _t = ((type nullable text) meta [Serialized.Text = true]) in type table [Name = _t, #"1.1" = _t, #"1.1 Score" = _t, #"1.2" = _t, #"1.2 Score" = _t, #"2.2" = _t, #"2.2 Score" = _t]),
#"Unpivoted Columns" = Table.UnpivotOtherColumns(Source, {"Name"}, "Context", "Value"),
#"Added Custom" = Table.AddColumn(#"Unpivoted Columns", "Type", each if Text.Contains([Context],"Score") then "Score" else "Attribute"),
#"Pivoted Column" = Table.Pivot(#"Added Custom", List.Distinct(#"Added Custom"[Type]), "Type", "Value"),
#"Extracted Text Before Delimiter" = Table.TransformColumns(#"Pivoted Column", {{"Context", each Text.BeforeDelimiter(_, " "), type text}}),
#"Grouped Rows" = Table.Group(#"Extracted Text Before Delimiter", {"Name", "Context"}, {{"Attribute", each List.Max([Attribute]), type nullable text}, {"Score", each List.Max([Score]), type nullable number}})
in
#"Grouped Rows"
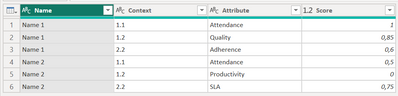
Before:
After:
Proud to be a Super User!
thank you sir! awesome work.. had to look at each step to understand what happened
pretty creative to use the 1.1 etc to group columns together.. appreciate it!
I am happy to hear that I could help. 🙂 If some steps are unclear for you (why I did that) - just ask.
P.S. It's not important, but I am a girl 😁 Not "sir".
Proud to be a Super User!
so sorry >< thanks a lot ms. bolfri and happy holiday
let
Source = Table.FromRows(Json.Document(Binary.Decompress(Binary.FromText("i45W8kvMTVUwVNJRciwpSc1LScxLTgVyDA0MdAwMVIGswNLEnMySSiDLwhQq5JiSkVqUClFoBlEXqwM1yQjdJFOYQQFF+SmlySWZZRDTYMLBPo5A0hxidmwsAA==", BinaryEncoding.Base64), Compression.Deflate)), let _t = ((type nullable text) meta [Serialized.Text = true]) in type table [Name = _t, #"1.1" = _t, #"1.1 Score" = _t, #"1.2" = _t, #"1.2 Score" = _t, #"2.2" = _t, #"2.2 Score" = _t]),
#"Unpivoted Columns" = Table.UnpivotOtherColumns(Source, {"Name"}, "Context", "Value"),
#"Added Custom" = Table.AddColumn(#"Unpivoted Columns", "Type", each if Text.Contains([Context],"Score") then "Score" else "Attribute"),
#"Pivoted Column" = Table.Pivot(#"Added Custom", List.Distinct(#"Added Custom"[Type]), "Type", "Value"),
#"Extracted Text Before Delimiter" = Table.TransformColumns(#"Pivoted Column", {{"Context", each Text.BeforeDelimiter(_, " "), type text}}),
#"Grouped Rows" = Table.Group(#"Extracted Text Before Delimiter", {"Name", "Context"}, {{"Attribute", each List.Max([Attribute]), type nullable text}, {"Score", each List.Max([Score]), type nullable number}})
in
#"Grouped Rows"
Before:
After:
Proud to be a Super User!
Join us in Barcelona for FabCon and SQLCon, the Fabric, Power BI, SQL, and AI community event. Save €200 with code FABCMTY200.
If you love stickers, then you will definitely want to check out our community sticker challenge, Barcelona edition!
Check out the July 2026 Power BI update to learn about new features.
| User | Count |
|---|---|
| 31 | |
| 28 | |
| 24 | |
| 24 | |
| 19 |
| User | Count |
|---|---|
| 44 | |
| 31 | |
| 17 | |
| 17 | |
| 15 |