Get Fabric or SQL Certified for Free.
Get certified for free when you join Fabric Data Days 2026 and dive into Fabric, Power BI, SQL, AI, and other essential data skills.
Join now- Power BI forums
- Get Help with Power BI
- Desktop
- Service
- Report Server
- Power Query
- Mobile Apps
- Developer
- DAX Commands and Tips
- Custom Visuals Development Discussion
- Health and Life Sciences
- Power BI Spanish forums
- Translated Spanish Desktop
- Training and Consulting
- Instructor Led Training
- Dashboard in a Day for Women, by Women
- Galleries
- Data Stories Gallery
- Themes Gallery
- Contests Gallery
- QuickViz Gallery
- Quick Measures Gallery
- Visual Calculations Gallery
- Fabric Apps Gallery
- Notebook Gallery
- Translytical Task Flow Gallery
- TMDL Gallery
- R Script Showcase
- Webinars and Video Gallery
- Ideas
- Custom Visuals Ideas (read-only)
- Issues
- Issues
- Events
- Upcoming Events
July 28 - August 9 | Final Round of the Power BI Dataviz World Championships. This is your chance. Learn more
- Power BI forums
- Forums
- Get Help with Power BI
- Desktop
- Re: Multiple Table Relationships
- Subscribe to RSS Feed
- Mark Topic as New
- Mark Topic as Read
- Float this Topic for Current User
- Bookmark
- Subscribe
- Printer Friendly Page

- Mark as New
- Bookmark
- Subscribe
- Mute
- Subscribe to RSS Feed
- Permalink
- Report Inappropriate Content
Multiple Table Relationships
Hi all,
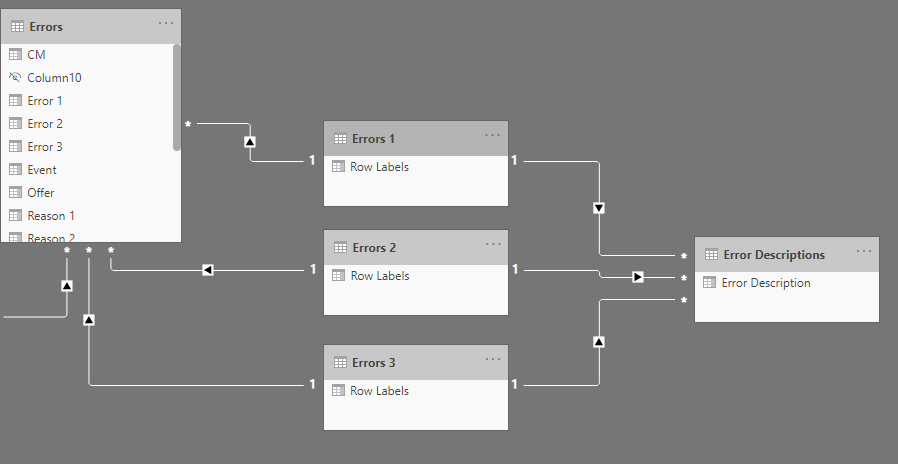
Happy Friday! I'm having a bit of difficluty with a bar graph visual I'm working on. I'm relatively new to Power BI and I believe my issue is stemming from my table relationships. What I am trying to do is take the total count of each error and show it onto a bar graph split by each error description (please see the first screenshot for the erros). The issue I'm having is that the bar graph is totaling the count onto one description, in this case 'date', instead of splitting it up to 4 for 'date' and 1 for 'Slins'. The measure I have on the bar graph is totaling on the count for 'Errors 1', 'Errors 2', and 'Errors 3'. The 3rd screenshot is the relationships I currently have. Because the errors are separated into 3 columns, I had to figure out a way to have each related somehow so I made 3 separate tables and had those connected to a master table with each description in it. If you need me to provide any other additonal information please let me know. Any help would be greatly appreciated, thanks!


Solved! Go to Solution.

- Mark as New
- Bookmark
- Subscribe
- Mute
- Subscribe to RSS Feed
- Permalink
- Report Inappropriate Content
Hi @seangovind,
I'd like to suggest you unpivot your error fields to convert them to attribute and value, then you can create a simple relationship mapping tables and do calculations across multiple error fields.
Regards,
Xiaoxin Sheng
- Mark as New
- Bookmark
- Subscribe
- Mute
- Subscribe to RSS Feed
- Permalink
- Report Inappropriate Content
Hi @seangovind,
I'd like to suggest you unpivot your error fields to convert them to attribute and value, then you can create a simple relationship mapping tables and do calculations across multiple error fields.
Regards,
Xiaoxin Sheng
- Mark as New
- Bookmark
- Subscribe
- Mute
- Subscribe to RSS Feed
- Permalink
- Report Inappropriate Content
@Anonymous Thank you so much that worked perfectly!


- Mark as New
- Bookmark
- Subscribe
- Mute
- Subscribe to RSS Feed
- Permalink
- Report Inappropriate Content
@seangovind it is surely the modelling issue, I would recommend to create sample pbix file non-sensitive data and share it. Also, make sure to share any data file you use in the report, it will help to model it correctly and solve your problem.
Subscribe to the @PowerBIHowTo YT channel for an upcoming video on List and Record functions in Power Query!!
Learn Power BI and Fabric - subscribe to our YT channel - Click here: @PowerBIHowTo
If my solution proved useful, I'd be delighted to receive Kudos. When you put effort into asking a question, it's equally thoughtful to acknowledge and give Kudos to the individual who helped you solve the problem. It's a small gesture that shows appreciation and encouragement! ❤
Did I answer your question? Mark my post as a solution. Proud to be a Super User! Appreciate your Kudos 🙂
Feel free to email me with any of your BI needs.
- Mark as New
- Bookmark
- Subscribe
- Mute
- Subscribe to RSS Feed
- Permalink
- Report Inappropriate Content
Good afternoon,
I actually am not too sure how to share the files on here, but I see a link to your email, so I will shoot you an email containing them.
Thank you so much!
Sean Govind
- Mark as New
- Bookmark
- Subscribe
- Mute
- Subscribe to RSS Feed
- Permalink
- Report Inappropriate Content
@seangovind you can share using one drive/google drive.
Subscribe to the @PowerBIHowTo YT channel for an upcoming video on List and Record functions in Power Query!!
Learn Power BI and Fabric - subscribe to our YT channel - Click here: @PowerBIHowTo
If my solution proved useful, I'd be delighted to receive Kudos. When you put effort into asking a question, it's equally thoughtful to acknowledge and give Kudos to the individual who helped you solve the problem. It's a small gesture that shows appreciation and encouragement! ❤
Did I answer your question? Mark my post as a solution. Proud to be a Super User! Appreciate your Kudos 🙂
Feel free to email me with any of your BI needs.
- Mark as New
- Bookmark
- Subscribe
- Mute
- Subscribe to RSS Feed
- Permalink
- Report Inappropriate Content
I uploaded the files to Google Drive and the link is below. Please let me know if you have any trouble opening the link. Thanks!
https://drive.google.com/drive/folders/1owKP8snAk3KPnWmXxfp4tKo-_Gxl3jyE?usp=sharing
Helpful resources

Fabric Community Sticker Challenge - Barcelona 2026
If you love stickers, then you will definitely want to check out our community sticker challenge, Barcelona edition!

Power BI Monthly Update - July 2026
Check out the July 2026 Power BI update to learn about new features.

Power BI DataViz World Championships - June 2026
A new Power BI DataViz World Championship is coming this June! Don't miss out on submitting your entry.

| User | Count |
|---|---|
| 29 | |
| 28 | |
| 20 | |
| 20 | |
| 19 |


| User | Count |
|---|---|
| 35 | |
| 28 | |
| 21 | |
| 19 | |
| 17 |


