Get certified for free when you join Fabric Data Days 2026 and dive into Fabric, Power BI, SQL, AI, and other essential data skills.
Join nowJuly 28 - August 9 | Final Round of the Power BI Dataviz World Championships. This is your chance. Learn more
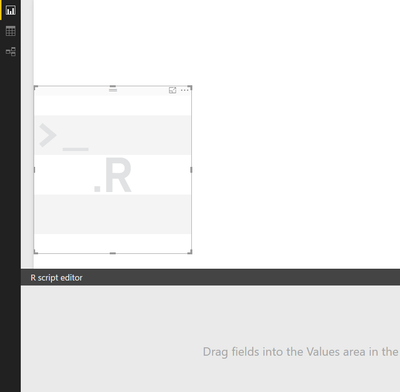
I am using R visual in Power BI .
I have an existing R code that has multiple visualisations (histogram , pie chart , scatter plot ,bar chart etc)
But the processing part is common for all the above visualisation and I dont want they run multiple time for creation of each of the visualisation.
How can I achieve that ? currently I have to use 4 R visuals in Power BI , all of them are running a same common code to create 4 visuals that I need ... very frustrating
Solved! Go to Solution.
Hi @jimmymitra,
As @v-yulgu-msft has indicated, you could move your data processing R script to R Connector. Check this link for details from Microsoft documents.
You can do your processing using R script and then use the resulting data set to create your R visuals.
If you already have the data in Power BI and need to use R to do further cleasing/manipulation you could use R Script in the Query Editor and use the resulting data set in your R visuals. Check this link from Microsoft document.
Either way (based on your requirement) you can centralise the R Script data processing/ETL in one place and use the resulting data set to create your R visuals.
Hope this helps.
Hi @jimmymitra,
What common code did you use to run R visuals? How did you run R code in Power BI? Via R script visual or loading R script in data connector?
Regards,
Yuliana Gu
I run it Via R script visual .
In my code , I have some lines of code to prepare my dataframe that I will be using for multiple visulisation (histogram , scatter plot,pie chart etc)
But with R script visual ,for every visual , I need to run the R code upto the dataframe creation and then I have separate code in the visuals for separate type of plots.
I think this is not a very efficient way of doing things , as the same process is running 4 times for 4 different plots
Hi @jimmymitra,
As @v-yulgu-msft has indicated, you could move your data processing R script to R Connector. Check this link for details from Microsoft documents.
You can do your processing using R script and then use the resulting data set to create your R visuals.
If you already have the data in Power BI and need to use R to do further cleasing/manipulation you could use R Script in the Query Editor and use the resulting data set in your R visuals. Check this link from Microsoft document.
Either way (based on your requirement) you can centralise the R Script data processing/ETL in one place and use the resulting data set to create your R visuals.
Hope this helps.
Join us in Barcelona for FabCon and SQLCon, the Fabric, Power BI, SQL, and AI community event. Save €200 with code FABCMTY200.
If you love stickers, then you will definitely want to check out our community sticker challenge, Barcelona edition!
Check out the July 2026 Power BI update to learn about new features.
| User | Count |
|---|---|
| 25 | |
| 23 | |
| 22 | |
| 17 | |
| 14 |
| User | Count |
|---|---|
| 25 | |
| 24 | |
| 20 | |
| 20 | |
| 19 |