cancel
Showing results forย 
Search instead forย 
Did you mean:ย 

July 7 - July 17 | Round 2 of the Power BI Dataviz World Championships. Don't miss your chance! Learn more

Reply
kala2
Helper III
Helper III

Milestone Trend Analysis Using Python

Following the example of the implementation on the github repo:
https://github.com/barakb32/PBI-MTA

And the topics:
https://community.powerbi.com/t5/Desktop/Create-Milestone-Trend-Analysis-MTA-in-Power-BI/m-p/191509
https://community.powerbi.com/t5/Developer/Milestone-Trend-Analysis/m-p/1366360

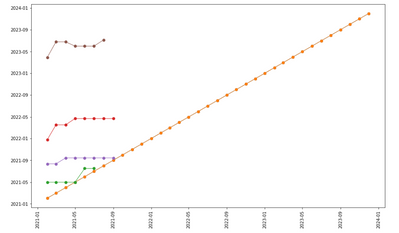
I want to create a milestone trend analysis like the image below:

kala2_0-1634578573051.png


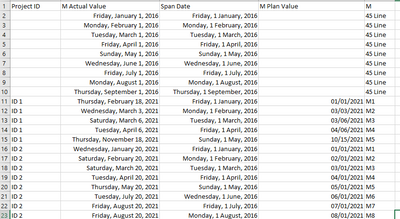
My dataset is in the following format: 

kala2_1-1634579081367.png


And my python script: 


# The following code to create a dataframe and remove duplicated rows is always executed and acts as a preamble for your script: 

# dataset = pandas.DataFrame(M Actual Value, M, M Plan Value)
# dataset = dataset.drop_duplicates()

# Paste or type your script code here:
import matplotlib.pyplot as plt, datetime
import matplotlib.dates as mdates

dataset['Span Date']=pandas.to_datetime(dataset['Span Date'])
dataset['M Actual Value']=pandas.to_datetime(dataset['M Actual Value'])

pivot=pandas.pivot_table(dataset, aggfunc='first', index="M Actual Value", values='Span Date', columns='M')

for column in pivot:
    clean=pivot[['45 Line',column]]
    clean=clean[clean[column].notnull()]
    plt.plot_date(clean['45 Line'],clean[column],xdate=True,ydate=True,ls='-', lw=1)    
plt.xticks(rotation=0)

dtFmt = mdates.DateFormatter('%Y-%m') # define the formatting
plt.gca().xaxis.set_major_formatter(dtFmt)
plt.gca().yaxis.set_major_formatter(dtFmt)
plt.show()


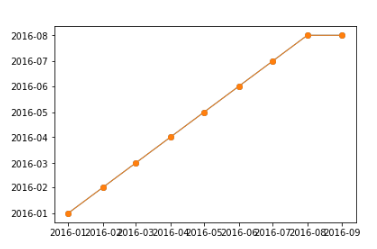
The final Output is:

kala2_2-1634579162575.png

Is there any way to display correct days? I notice years (1600+ etc) that are not in my data.


1 ACCEPTED SOLUTION
v-chenwuz-msft
Community Support
Community Support

Hi @kala2 


It seems that the problem is in your python statement, under the for column in pivot.

Because some rows with NaT, so you should try to remove the null rows.

I'm not particularly skilled in python either. Maybe this code replace it.

plt.plot_date(clean['45 Line'].dropna(axis=0).index,clean[column].dropna(axis=0).values,xdate=True,ydate=True,ls='-', lw=1)

vchenwuzmsft_0-1634797007477.png


Best Regards

Community Support Team _ chenwu zhu


If this post helps, then please consider Accept it as the solution to help the other members find it more quickly.

View solution in original post

1 REPLY 1
v-chenwuz-msft
Community Support
Community Support

Hi @kala2 


It seems that the problem is in your python statement, under the for column in pivot.

Because some rows with NaT, so you should try to remove the null rows.

I'm not particularly skilled in python either. Maybe this code replace it.

plt.plot_date(clean['45 Line'].dropna(axis=0).index,clean[column].dropna(axis=0).values,xdate=True,ydate=True,ls='-', lw=1)

vchenwuzmsft_0-1634797007477.png


Best Regards

Community Support Team _ chenwu zhu


If this post helps, then please consider Accept it as the solution to help the other members find it more quickly.

Helpful resources

Announcements
FabCon and SQLCon Barcelona 2026

FabCon & SQLCon โ€“ Barcelona 2026

Join us in Barcelona for FabCon and SQLCon, the Fabric, Power BI, SQL, and AI community event. Save โ‚ฌ200 with code FABCMTY200.

Fabric Community Sticker Design Challenge Barcelona Carousel

Fabric Community Sticker Challenge - Barcelona 2026

If you love stickers, then you will definitely want to check out our community sticker challenge, Barcelona edition!

July Power BI Update Carousel

Power BI Monthly Update - July 2026

Check out the July 2026 Power BI update to learn about new features.

Power BI DataViz World Championships carousel

Power BI DataViz World Championships - June 2026

A new Power BI DataViz World Championship is coming this June! Don't miss out on submitting your entry.

Top Solution Authors