Get certified for free when you join Fabric Data Days 2026 and dive into Fabric, Power BI, SQL, AI, and other essential data skills.
Join nowJuly 28 - August 9 | Final Round of the Power BI Dataviz World Championships. This is your chance. Learn more
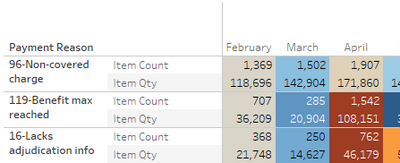
I'm relatively new to PowerBI but pretty fluent in Tableau. Is there a way of splitting different numeric values onto rows over time like this:
Solved! Go to Solution.
In the settings area for "Values" enable the toggle "Show on rows"
in the Values area of the visual you can click the dropdown next to the measure and "Rename for this visual"
Thank you so much! That was exactly what I needed.
Sorry for the followup but how do I change the title of the column titles? Where I might see "Sum of Revenue" and "Count of Sales Orders"
in the Values area of the visual you can click the dropdown next to the measure and "Rename for this visual"
Thanks again! Hey, I have a value that I want to format with commas. I highlighted the field in the Data tab and formatted with the format tab. When the value enters the viz as a SUM, the formatting is correct but when I change the value to a Distinct Count I lose formatting. Any idea how to fix it?
a distinct count with commas? really? What locale uses that?
Anyway , read about the FORMAT DAX function.
In the settings area for "Values" enable the toggle "Show on rows"
Join us in Barcelona for FabCon and SQLCon, the Fabric, Power BI, SQL, and AI community event. Save €200 with code FABCMTY200.
If you love stickers, then you will definitely want to check out our community sticker challenge, Barcelona edition!
Check out the July 2026 Power BI update to learn about new features.
| User | Count |
|---|---|
| 30 | |
| 28 | |
| 25 | |
| 24 | |
| 16 |
| User | Count |
|---|---|
| 45 | |
| 32 | |
| 17 | |
| 16 | |
| 16 |