Get certified for free when you join Fabric Data Days 2026 and dive into Fabric, Power BI, SQL, AI, and other essential data skills.
Join nowJuly 7 - July 17 | Round 2 of the Power BI Dataviz World Championships. Don't miss your chance! Learn more
Hello,
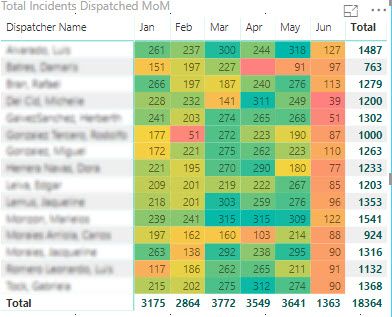
I'm new to Power BI and with that, I'm struggling with something basic, yet I believe simple. In a Matrix I created in PBI Desktop I managed to get the amount of incidents dispatched per analyst YTD by month. Now, Out of that calculation shown, I need to calculate the Dispatched Rate per month, per agent. I have tried about anything and I can't seem to get this working, any help you can give me?
This is the Matrix I managed to get done in PBI: (Total of Incidents Dispatched per Analyst per month):
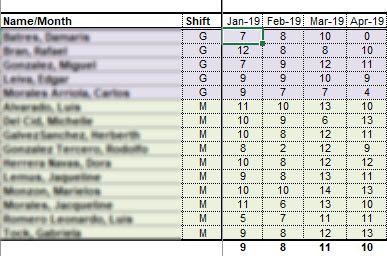
And this is the table I have created in Excel with the Dispatched Rate calculation, for this, I used the following formula: =C3/NETWORKDAYS($C$21,EOMONTH($C$21,0)), where C3 makes reference to the total of the incidents dispatched per Analyst, divided by the Network days of the month in question:
Any thoughts will be appreciated
Thanks!
Solved! Go to Solution.
Hi @GReyes85 ,
Can you please more about your data structure and matrix fields to help clarify your scenario? It is hard to coding formula without any detail informations.
You can also try to use following measure formula if it works:
Measure =
VAR currDate =
MAX ( Table[Date] )
RETURN
DIVIDE (
COUNT ( Table[Column] ),
COUNTROWS (
FILTER (
CALENDAR ( currDate, DATE ( YEAR ( currDate ), MONTH ( currDate ) + 1, 1 ) - 1 ),
WEEKDAY ( [Date], 2 ) <= 5
)
)
)
Regards,
Xiaoxin Sheng
Hi @GReyes85 ,
Can you please more about your data structure and matrix fields to help clarify your scenario? It is hard to coding formula without any detail informations.
You can also try to use following measure formula if it works:
Measure =
VAR currDate =
MAX ( Table[Date] )
RETURN
DIVIDE (
COUNT ( Table[Column] ),
COUNTROWS (
FILTER (
CALENDAR ( currDate, DATE ( YEAR ( currDate ), MONTH ( currDate ) + 1, 1 ) - 1 ),
WEEKDAY ( [Date], 2 ) <= 5
)
)
)
Regards,
Xiaoxin Sheng
Join us in Barcelona for FabCon and SQLCon, the Fabric, Power BI, SQL, and AI community event. Save €200 with code FABCMTY200.
Join Data Days 2026: 60 days of free live/on-demand sessions, challenges, study groups, and certification opportunities.
| User | Count |
|---|---|
| 26 | |
| 25 | |
| 19 | |
| 19 | |
| 15 |
| User | Count |
|---|---|
| 48 | |
| 45 | |
| 43 | |
| 39 | |
| 37 |