cancel
Showing results for 
Search instead for 
Did you mean: 

July 7 - July 17 | Round 2 of the Power BI Dataviz World Championships. Don't miss your chance! Learn more

Reply
nirvana_moksh
Impactful Individual

Matrix Visual Stepped Layout Out Off Error

Hello All,


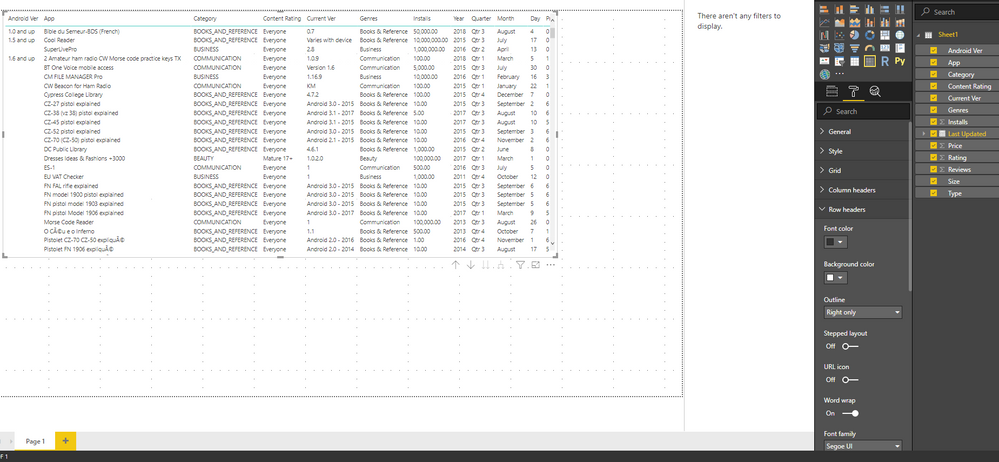
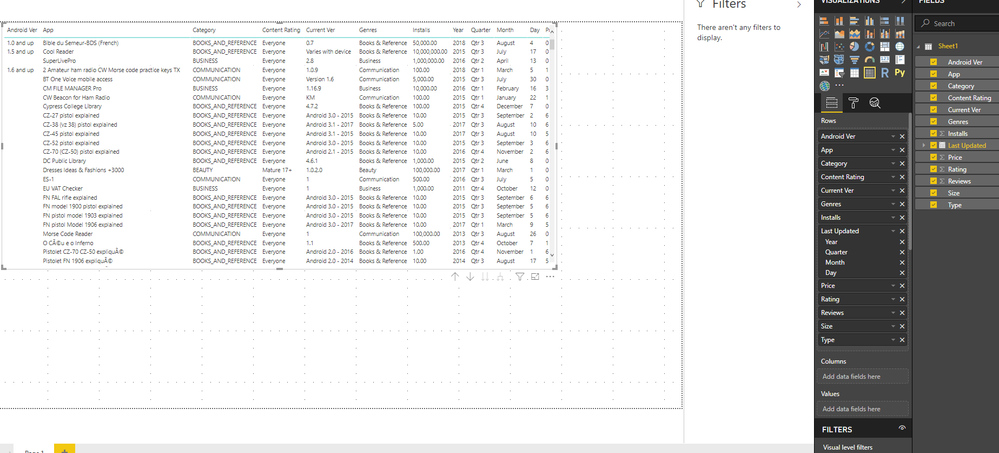
So I have this matrix built in which I want the stepped layout off because each column I add I want it adjacent to one another rather than stepped out.  When I keep the stepped layout feature off I achieve what I want but after few additions of columns, the visual does not show any scrolling options. Is this expected behavior? Below is demo data's screenshot:


21.PNG      


221.PNG 


Thank You

4 REPLIES 4
v-juanli-msft
Community Support
Community Support

Hi @nirvana_moksh

As tested, when you add many columns in the "Row" field of Matrix, it doesn't show scrolling options on the bottom of the matrix visual to let you navigate to the last columns.

When you add  many columns in the "Column" field of Matrix, it shows scrolling options on the bottom of the matrix visual to let you navigate to the last columns.

Based on my experience using Power BI, it seems not a bug.


Best Regards

Maggie 

Hello @v-juanli-msft any update on my reply?

So are you saying, it is expected behavior if we add too many columns in the "Rows" field that the scrollbar won't show, but it will allow us to add as many columns as we can? I would say that is a bug then, or am I missing something?


And adding these columns in the "Column" field does show the scrollbar which I had no issues with, but it does not give the results I want it to. For instance, all numerical columns in my dataset then have a column for each value which I don't want. The end result should be what I see when columns are added to the "Rows" fields.


columns.PNG

Hi @nirvana_moksh

If i understand you correctly, you'd like to add columns in the Matrix but keep "scrollbar" shown,

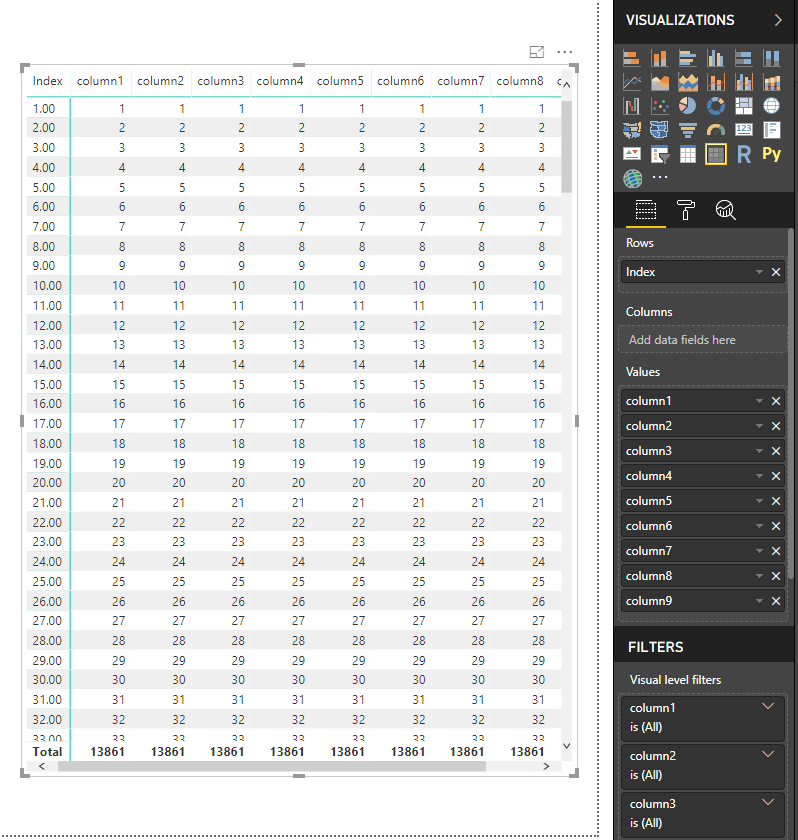
You could add columns in the "row" and "value" field of A matrix visual like this

1.png


Or add columns in the Table visual

2.png


Best Regards

Maggie

Helpful resources

Announcements
FabCon and SQLCon Barcelona 2026

FabCon & SQLCon – Barcelona 2026

Join us in Barcelona for FabCon and SQLCon, the Fabric, Power BI, SQL, and AI community event. Save €200 with code FABCMTY200.

60 days of Data Days Carousel

Data Days 2026

Join Fabric Data Days 2026: 60 days of free live/on-demand sessions, challenges, study groups, and certification opportunities.

Power BI DataViz World Championships carousel

Power BI DataViz World Championships - June 2026

A new Power BI DataViz World Championship is coming this June! Don't miss out on submitting your entry.

Top Solution Authors