FabCon is coming to Atlanta
Join us at FabCon Atlanta from March 16 - 20, 2026, for the ultimate Fabric, Power BI, AI and SQL community-led event. Save $200 with code FABCOMM.
Register now!- Power BI forums
- Get Help with Power BI
- Desktop
- Service
- Report Server
- Power Query
- Mobile Apps
- Developer
- DAX Commands and Tips
- Custom Visuals Development Discussion
- Health and Life Sciences
- Power BI Spanish forums
- Translated Spanish Desktop
- Training and Consulting
- Instructor Led Training
- Dashboard in a Day for Women, by Women
- Galleries
- Data Stories Gallery
- Themes Gallery
- Contests Gallery
- Quick Measures Gallery
- Notebook Gallery
- Translytical Task Flow Gallery
- TMDL Gallery
- R Script Showcase
- Webinars and Video Gallery
- Ideas
- Custom Visuals Ideas (read-only)
- Issues
- Issues
- Events
- Upcoming Events
Join the Fabric FabCon Global Hackathon—running virtually through Nov 3. Open to all skill levels. $10,000 in prizes! Register now.
- Power BI forums
- Forums
- Get Help with Power BI
- Desktop
- KPI Visual - Simple Calculation
- Subscribe to RSS Feed
- Mark Topic as New
- Mark Topic as Read
- Float this Topic for Current User
- Bookmark
- Subscribe
- Printer Friendly Page
- Mark as New
- Bookmark
- Subscribe
- Mute
- Subscribe to RSS Feed
- Permalink
- Report Inappropriate Content
KPI Visual - Simple Calculation
I'm building out some sample data. I have a very simple data set that looks like this:
| Unit | Count | Spend | Month | Relative Month |
| Box | 1,234 | $100 | October | Current |
| Box | 5,678 | $801 | October | Current |
| Bag | 9,123 | $900 | September | Previous |
| Bag | 1,234 | $200 | September | Previous |
My hope is to create a simple KPI visual that shows the current month's performance (one visual for spend, one visual for count) and the +/- for the relative month. So, what I'd hope to see above is a large 6,912 representing units for the current month, then a Goal value of 10,327 (reprsenting prior month) and a % of -33% representing the difference between the current month and the prior month (goal).
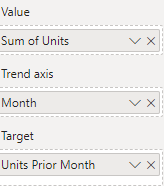
I have built measures representing units for current and prior month, etc. Right now my field list looks like this:
It just shows the prior month's value and the goal as the same number. I've also tried moving my Units Current Month measure to value and this just generates a Blank in the visual itself. Any thoughts?
Solved! Go to Solution.
- Mark as New
- Bookmark
- Subscribe
- Mute
- Subscribe to RSS Feed
- Permalink
- Report Inappropriate Content
Hi, @bensiqc ,
I tried something real quick:
Total Units Current =
CALCULATE(
    [Total Units],
    'KPI'[Relative Month] = "Current"
)
Total Units Previous =
CALCULATE(
[Total Units],
'KPI'[Relative Month] = "Previous"
)Total Units = SUM('KPI'[Count])
- Mark as New
- Bookmark
- Subscribe
- Mute
- Subscribe to RSS Feed
- Permalink
- Report Inappropriate Content
Thanks! This works. Seems like my issue was that I didn't make an explicit Units measure and was instead using the 'sum of units' column in the dataset itself.


