This is best Fabric, Power BI, SQL and AI community event. How do we know? The last event sold out! Save €200 with code FABCMTY200.
Register nowThe Fabric community is upgrading! Read all of the details including the timeline and what you can expect. Learn more
Hi,
I want to create a pareto grafh for monthly reporting. My plan is that I want to see the past month (Reporting Month) and the privious 3 months before that (In the same color).
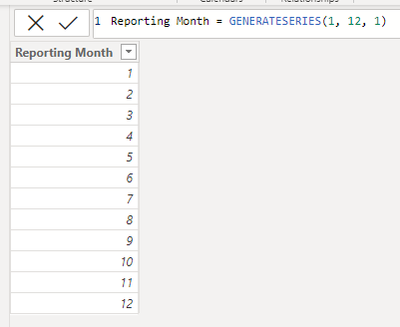
My plan was to create a promt to the user where they can chose the reporting month Number
I have created a Date_Tabel with a
Hi @hgrejsen ,
In order to better understand your demands and give the right solution, could you please provide some more specific information? such as your desensitized example data and a screenshot of your desired results?
Thanks for your efforts & time in advance.
Best regards,
Community Support Team_Binbin Yu
Hi @Anonymous,
If I were to do it in normal excel I would do it like this:
I hope this makes you understand what I want. In my trials in Power BI my IF function does not work when I try to use a prompted parameter but it does work when I just use a constant number.
Br Helene
Join us in Barcelona for FabCon and SQLCon, the Fabric, Power BI, SQL, and AI community event. Save €200 with code FABCMTY200.
| User | Count |
|---|---|
| 24 | |
| 22 | |
| 20 | |
| 18 | |
| 14 |
| User | Count |
|---|---|
| 32 | |
| 26 | |
| 23 | |
| 20 | |
| 20 |