This is best Fabric, Power BI, SQL and AI community event. How do we know? The last event sold out! Save €200 with code FABCMTY200.
Register nowJuly 28 - August 9 | Final Round of the Power BI Dataviz World Championships. This is your chance. Learn more
Hi,
I want to create a pareto grafh for monthly reporting. My plan is that I want to see the past month (Reporting Month) and the privious 3 months before that (In the same color).
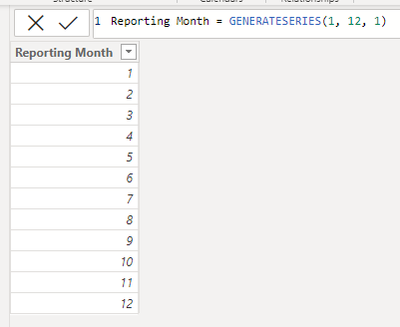
My plan was to create a promt to the user where they can chose the reporting month Number
I have created a Date_Tabel with a
Hi @hgrejsen ,
In order to better understand your demands and give the right solution, could you please provide some more specific information? such as your desensitized example data and a screenshot of your desired results?
Thanks for your efforts & time in advance.
Best regards,
Community Support Team_Binbin Yu
Hi @Anonymous,
If I were to do it in normal excel I would do it like this:
I hope this makes you understand what I want. In my trials in Power BI my IF function does not work when I try to use a prompted parameter but it does work when I just use a constant number.
Br Helene
Join us in Barcelona for FabCon and SQLCon, the Fabric, Power BI, SQL, and AI community event. Save €200 with code FABCMTY200.
If you love stickers, then you will definitely want to check out our community sticker challenge, Barcelona edition!
Check out the July 2026 Power BI update to learn about new features.
| User | Count |
|---|---|
| 25 | |
| 23 | |
| 19 | |
| 17 | |
| 14 |
| User | Count |
|---|---|
| 24 | |
| 23 | |
| 20 | |
| 20 | |
| 19 |