cancel
Showing results for 
Search instead for 
Did you mean: 

July 7 - July 17 | Round 2 of the Power BI Dataviz World Championships. Don't miss your chance! Learn more

Reply
Anonymous
Not applicable

How do I create needed table?

Hi everyone,


I need help and am not even sure how to word my issue so please, be kind.


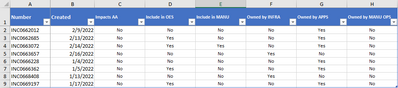
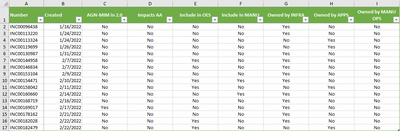
I have a an Excel file that brings in two tables.  The two tables have the same columns (except 1 has an additional column).  The first table we'll call "Our Company" and the second we'll call "Their Company".


Both tables have 6 columns that I need listed in the rows of a matrix and I need the count of how many in each row (call it Category) equal "Yes" in the first column.  I will be adding additional calculations in more columns.  I further need to show Our Company data and Their Company data on the same row.


Now, for the problem...I have no idea how to accomplish this.  I assume it will involve turning the column categories into a variable but I'm not very well versed in variables.  If I can just get the first formula done - the current count based on all rows - I can use that value to calculate the rest I think.


Here are screenshots of the data and desired output while I try to figure out how to attach the pbix.


Our Company:
Ruthie09_0-1648673509183.png


Their Company:

Ruthie09_1-1648673535581.png


Desired output layout:

Ruthie09_2-1648673568426.png


EDIT:  I can't figure out how to get the actual data into this post.  We aren't allowed to save things to a cloud and I don't know how to make my tables "proper HTML format".  Advice is welcome.


Thank you in advance.

5 REPLIES 5
amitchandak
Super User
Super User

@Anonymous , One is you might have to append these two tables or create a few common dimension. Second I see measure to dimension conversion, I think you have to use calculation groups


Append : https://radacad.com/append-vs-merge-in-power-bi-and-power-query


Calculation Groups- Measure Slicer, Measure Header Grouping, Measure to dimension conversion. Complex Table display : https://youtu.be/qMNv67P8Go0

Share with Power BI Enthusiasts: Full Power BI Video (20 Hours) YouTube
Microsoft Fabric Series 60+ Videos YouTube
Microsoft Fabric Hindi End to End YouTube
Anonymous
Not applicable

Another question...what if I cannot install Tabular Editor?  Are there other ways to accomplish this?

You can copy the data from Excel and post it directly into the message 


Did I answer your question? Mark my post as a solution!
In doing so, you are also helping me. Thank you!

Proud to be a Super User!
Paul on Linkedin.


Anonymous
Not applicable

Ok, I'm with you on the two links you sent but how do I turn those column headers into Categories?  

Anonymous
Not applicable

@amitchandak 

I'm with you on the two links you sent but how do I turn those column headers into Categories? 

Helpful resources

Announcements
FabCon and SQLCon Barcelona 2026

FabCon & SQLCon – Barcelona 2026

Join us in Barcelona for FabCon and SQLCon, the Fabric, Power BI, SQL, and AI community event. Save €200 with code FABCMTY200.

60 days of Data Days Carousel

Data Days 2026

Join Data Days 2026: 60 days of free live/on-demand sessions, challenges, study groups, and certification opportunities.

Power BI DataViz World Championships carousel

Power BI DataViz World Championships - June 2026

A new Power BI DataViz World Championship is coming this June! Don't miss out on submitting your entry.

Top Solution Authors