This is best Fabric, Power BI, SQL and AI community event. How do we know? The last event sold out! Save €200 with code FABCMTY200.
Register nowThe Fabric community is upgrading! Read all of the details including the timeline and what you can expect. Learn more
Hello! I am new on here - first post!!
I have a measure calculated as: Missed Meal Hrs = count('Final Data'[Employee ID])*.5
I am trying to create another measure that would take a min value of the above measure and another value:
Missed Meal OT = min(sum('my data'[Overtime Hours]),[Missed Meal Hrs])
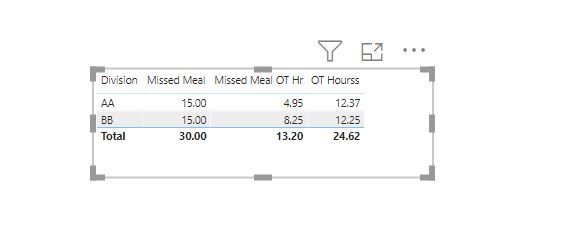
the structure of my data is such that for each [Employee ID] I have multiple rows. then all Employee IDs can be grouped into areas. When I look at my data as a table where each row is an Employee ID - the 2 formulas above calculate correctly. But when I take Employee IDs out of the table, and each row is now an Area - the Missed Meal OT formula does not aggregate at the Employee ID level, and tries to just use the totals of each area, which is not what I want. Any help would be greatly appreciated!
For some reason, I'm having a hard time with copying a table into the body of the comment and don't see how to attach a file. Hopefully this link works:
https://www.dropbox.com/s/atwxz9wezhz1tna/Book1.xlsx?dl=0
Division | Employee ID | Missed Meal Hrs | OT Hours | Missed Meal OT hours |
| AA | 12345 | 2.5 | 0 | 0 |
| AA | 12346 | 2.5 | 0 | 0 |
| AA | 12347 | 2.5 | 0.22 | 0.22 |
| AA | 12348 | 2.5 | 9.92 | 2.5 |
| AA | 12349 | 2.5 | 2.18 | 2.18 |
| AA | 12350 | 2.5 | 0.05 | 0.05 |
| BB | 12351 | 2.5 | 2.93 | 2.5 |
| BB | 12352 | 2.5 | 0 | 0 |
| BB | 12353 | 2.5 | 0.6 | 0.6 |
| BB | 12354 | 2.5 | 3.75 | 2.5 |
| BB | 12355 | 2.5 | 4.82 | 2.5 |
| BB | 12356 | 2.5 | 0.15 | 0.15 |
| Desired output | Missed Meal Hrs | OT Hours | Missed Meal OT hours |
| AA total | 15.00 | 12.37 | 4.95 |
| BB Total | 15.00 | 12.25 | 8.25 |
| What I am getting: | Missed Meal Hrs | OT Hours | Missed Meal OT hours |
| AA total | 15.00 | 12.37 | 12.37 |
| BB Total | 15.00 | 12.25 | 12.25 |
Hi @kdunaev ,
You can use the below measures.
@kdunaev , I think somehow I am not getting what you were getting
https://docs.microsoft.com/en-us/power-bi/create-reports/desktop-accessibility-keyboard-shortcuts
Join us in Barcelona for FabCon and SQLCon, the Fabric, Power BI, SQL, and AI community event. Save €200 with code FABCMTY200.
| User | Count |
|---|---|
| 24 | |
| 22 | |
| 20 | |
| 18 | |
| 14 |
| User | Count |
|---|---|
| 31 | |
| 26 | |
| 23 | |
| 20 | |
| 20 |