FabCon is coming to Atlanta
Join us at FabCon Atlanta from March 16 - 20, 2026, for the ultimate Fabric, Power BI, AI and SQL community-led event. Save $200 with code FABCOMM.
Register now!- Power BI forums
- Get Help with Power BI
- Desktop
- Service
- Report Server
- Power Query
- Mobile Apps
- Developer
- DAX Commands and Tips
- Custom Visuals Development Discussion
- Health and Life Sciences
- Power BI Spanish forums
- Translated Spanish Desktop
- Training and Consulting
- Instructor Led Training
- Dashboard in a Day for Women, by Women
- Galleries
- Data Stories Gallery
- Themes Gallery
- Contests Gallery
- QuickViz Gallery
- Quick Measures Gallery
- Visual Calculations Gallery
- Notebook Gallery
- Translytical Task Flow Gallery
- TMDL Gallery
- R Script Showcase
- Webinars and Video Gallery
- Ideas
- Custom Visuals Ideas (read-only)
- Issues
- Issues
- Events
- Upcoming Events
The Power BI Data Visualization World Championships is back! Get ahead of the game and start preparing now! Learn more
- Power BI forums
- Forums
- Get Help with Power BI
- Desktop
- Help Structuring Table - cleaning up my mess
- Subscribe to RSS Feed
- Mark Topic as New
- Mark Topic as Read
- Float this Topic for Current User
- Bookmark
- Subscribe
- Printer Friendly Page
- Mark as New
- Bookmark
- Subscribe
- Mute
- Subscribe to RSS Feed
- Permalink
- Report Inappropriate Content
Help Structuring Table - cleaning up my mess
Hello,
I have been under alot of pressure to get dashboards/reports out and also upskill my self on Power BI.
Whlile there has been a very positive uptake of these, i need to do ALOT of clean up work on my data structure.
This is what my relationships look like. shocking i know.
What i need help on is what is the best relationship to create.
Lets start simple.
- I have a Multiple closing balance report which is the main report, i download this at the start of every month. I want to be able to track changes in employees numbers, pay increases, etc etc
- I have a Attrition report, which i update/refresh every month so i can track attrition trends etc.
- I have a Hire Report which is similar to Attrition report.
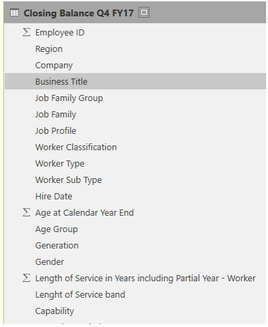
here are the fields for each report:
Closing Balance (i download a copy every month and create a new table - so i can review changes) - i would like someway to create a filter so i can filter by month.
Attrition Report (i only download once and refresh the table)
Hire Report (same as above)
I have created so many relationships etc to make the data present the way I want, so I still managed to achieve the outcome needed but as you can see the relationships are a mess.
Thankyou so much!!!
Ben
Solved! Go to Solution.
- Mark as New
- Bookmark
- Subscribe
- Mute
- Subscribe to RSS Feed
- Permalink
- Report Inappropriate Content
I'd start with putting all the closing balances in a single table
for comparison I'd just add new column to each table that would specify the period it relates to (e.g. Q1 FY1, Q1 HY1 etc. all in one column)
if you have any other examples of tables sharing the same structure but being separated I would think about putting them together as well
Thank you for the kudos 🙂
- Mark as New
- Bookmark
- Subscribe
- Mute
- Subscribe to RSS Feed
- Permalink
- Report Inappropriate Content
Hi bengia ,
What is your fact table and dimensional tables, based on your diagram, it seems like table "Closing Balance" has many-to-one relationships with other tables. And you want to filter or achieve values from other dimensional tables in "Closing Balance", right? So I would recommend you to re-organize your table relationship in a start schema, please refer to: https://en.wikipedia.org/wiki/Star_schema. In this senario, make sure that values in key columns is unique in your dimensional tables.
Regards,
Jimmy Tao
- Mark as New
- Bookmark
- Subscribe
- Mute
- Subscribe to RSS Feed
- Permalink
- Report Inappropriate Content
I'd start with putting all the closing balances in a single table
for comparison I'd just add new column to each table that would specify the period it relates to (e.g. Q1 FY1, Q1 HY1 etc. all in one column)
if you have any other examples of tables sharing the same structure but being separated I would think about putting them together as well
Thank you for the kudos 🙂
- Mark as New
- Bookmark
- Subscribe
- Mute
- Subscribe to RSS Feed
- Permalink
- Report Inappropriate Content
Tthanks so much for reccomendation of merging into a single table.
ive created a single table and now its worked for me. i can now trend data and it looks flash.
thanks!
Helpful resources

Power BI Monthly Update - November 2025
Check out the November 2025 Power BI update to learn about new features.

Fabric Data Days
Advance your Data & AI career with 50 days of live learning, contests, hands-on challenges, study groups & certifications and more!

| User | Count |
|---|---|
| 58 | |
| 45 | |
| 42 | |
| 20 | |
| 18 |


