Get certified for free when you join Fabric Data Days 2026 and dive into Fabric, Power BI, SQL, AI, and other essential data skills.
Join nowJuly 7 - July 17 | Round 2 of the Power BI Dataviz World Championships. Don't miss your chance! Learn more
Hello, I am a beginner in Power BI and I couldn't solve this problem on my own.
I have a table with the following columns:
| Task Name | Status | Priority | Task Completion Date | Priority Interval(Custom Column) |
| Task Name 1 | Completed | 1.4 | 5.06.2023 | 0-1.5 Priority |
| Task Name 2 | Waiting | 2.3 | null | 1.5-3.5 Priority |
| Task Name 3 | Postponed | 3 | null | 1.5-3.5 Priority |
| Task Name 5 | null | 5 | null | 3.5-5 Priority |
| ............ | .............. | .......... | ................. | .......................... |
By using this data source, I have created a stacked bar chart. On the X-Axis, it shows priority intervals while on the Y-Axis it shows amount of tasks grouped according to their statuses. I created 4 measures for each of statuses in table by filtering status measure. So far chart looks like this:
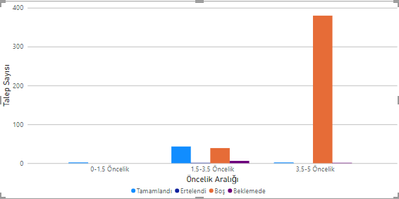
The problem I encounter is when I apply a slicer which uses "Task Completion Date" as value, it only filters tasks with "Completed" status, because other statuses don't have completion date. To prevent that, only measure "Tasks with Completed status" must be affected from slicer. Other 3 measures remain same. That means only one bar in the picture above should change when user interact with slicer while other 3 bars still same.
Thank you for your help.
Solved! Go to Solution.
Hi
Okay, so your measure for Completed should remain the same, but for the other statuses you can use something like this:
Postponed =
CALCULATE(
COUNTA('TableName'[TaskName]),
'TableName'[Status] IN { "Postponed" },
REMOVEFILTERS( 'TableName'[Task Completion Date] )
)
Hello @Adescrit , you can see DAX I have used below:
Hi
Okay, so your measure for Completed should remain the same, but for the other statuses you can use something like this:
Postponed =
CALCULATE(
COUNTA('TableName'[TaskName]),
'TableName'[Status] IN { "Postponed" },
REMOVEFILTERS( 'TableName'[Task Completion Date] )
)
@Adescrit It worked ,thank you so much. I guess I need to work on how to write DAX and DAX commands more 😄
Have a good day sir.
100%. DAX is the key to Power BI.
Hi @yigitarican are you able to provide the DAX you have used in one of your existing measures? I have an idea how to solve this but it would help if I can see what calculation you're currently doing.
Join us in Barcelona for FabCon and SQLCon, the Fabric, Power BI, SQL, and AI community event. Save €200 with code FABCMTY200.
Join Data Days 2026: 60 days of free live/on-demand sessions, challenges, study groups, and certification opportunities.
| User | Count |
|---|---|
| 27 | |
| 23 | |
| 18 | |
| 18 | |
| 15 |
| User | Count |
|---|---|
| 54 | |
| 44 | |
| 42 | |
| 39 | |
| 36 |