Get certified for free when you join Fabric Data Days 2026 and dive into Fabric, Power BI, SQL, AI, and other essential data skills.
Join nowJuly 28 - August 9 | Final Round of the Power BI Dataviz World Championships. This is your chance. Learn more
Dear all,
I have a little problem on Power Query,
In fact, I integrated TABLE1 from an Excel file and in Power BI and I want to transform the table and explode it according to the number of days off (by modifying the date each time of END) as shown below.
there is any solution to do it in Power Query PBI?
Solved! Go to Solution.
Hi @Anonymous
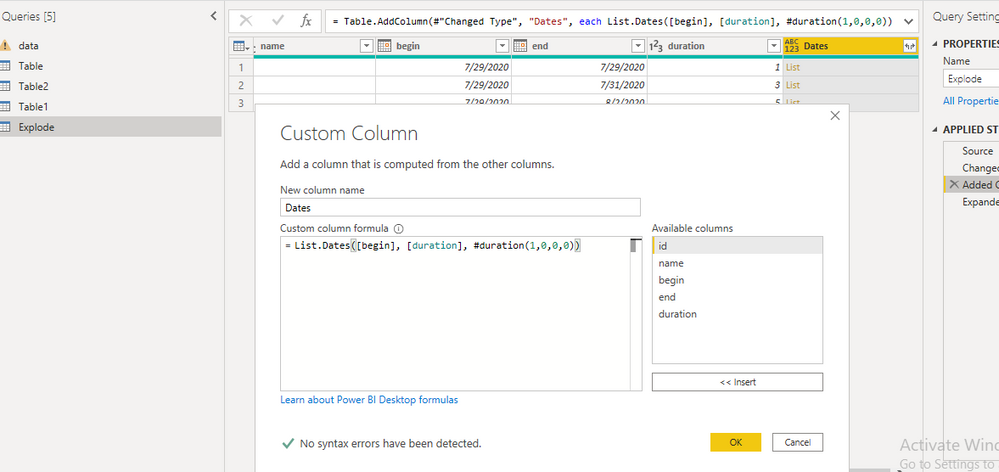
Create a Custom Column as shown below.
After creating above column expand the rows and apply necessary transformations.
Hope this helps.
Please mark as a solution if serves right.
Thanks
Hi @Anonymous
Create a Custom Column as shown below.
After creating above column expand the rows and apply necessary transformations.
Hope this helps.
Please mark as a solution if serves right.
Thanks
@Anonymous thank you 🙂
@Anonymous , Try like
Group by all other than end date. Take max of end Date
Join us in Barcelona for FabCon and SQLCon, the Fabric, Power BI, SQL, and AI community event. Save €200 with code FABCMTY200.
If you love stickers, then you will definitely want to check out our community sticker challenge, Barcelona edition!
Check out the July 2026 Power BI update to learn about new features.
| User | Count |
|---|---|
| 31 | |
| 28 | |
| 24 | |
| 24 | |
| 19 |
| User | Count |
|---|---|
| 44 | |
| 31 | |
| 17 | |
| 17 | |
| 15 |