cancel
Showing results for 
Search instead for 
Did you mean: 

July 28 - August 9 | Final Round of the Power BI Dataviz World Championships. This is your chance. Learn more

Reply
AMZ
Regular Visitor

Dynamic table

Hello,


I'm trying to create a dynamic table in Power BI.


I'll give the context:


I have an Excel file with several data tables.
I have a Power BI dashboard with a visual Filter and each filter corresponds to a table in the Excel file. I would like the table to change depending on the filter selected, taking the right data from the right table in the Excel file (depending on the filter selected on the visual, the table should take the right table and display the right data on the report).


My idea:


I thought of creating a calculated table with a formula that would say: "If on visual X, filter Y is selected then my table is T1 otherwise my table is T2." Something like that. In my idea, I need to specify exactly which visual it is, either with the exact name of the visual, or with a unique id.


If this is not possible, can you suggest an alternative solution?


Thanks in advance

2 ACCEPTED SOLUTIONS
123abc
Community Champion
Community Champion

Create a new calculated table in Power BI using DAX. You can use the SWITCH function along with values from the selected slicer to determine which table to display.


DynamicTable =
SWITCH (
SELECTEDVALUE('SlicerTable'[TableType]),
"T1", 'Table1',
"T2", 'Table2',
"T3", 'Table3',
// Add more conditions as needed
BLANK()
)


Replace 'SlicerTable' with the actual name of your slicer table and 'Table1', 'Table2', etc., with the actual names of your data tables.


If this post helps, then please consider Accepting it as the solution to help the other members find it more quickly.


In case there is still a problem, please feel free and explain your issue in detail, It will be my pleasure to assist you in any way I can.

View solution in original post

Anonymous
Not applicable

Hi @AMZ ,


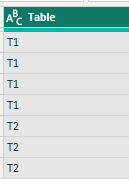
You can add table names in a new custom columns to your tables, such as T1, T2, and so on. The tables are then combined. Then you have a column about the table that you can use as a filter.

vstephenmsft_0-1702528006195.png

You could add a slicer to your report that will allow users to select the filter criteria(table name column). This slicer will act as the mechanism to change the data displayed in your table visual.


Best Regards,

Stephen Tao


If this post helps, then please consider Accept it as the solution to help the other members find it more quickly.           

View solution in original post

2 REPLIES 2
Anonymous
Not applicable

Hi @AMZ ,


You can add table names in a new custom columns to your tables, such as T1, T2, and so on. The tables are then combined. Then you have a column about the table that you can use as a filter.

vstephenmsft_0-1702528006195.png

You could add a slicer to your report that will allow users to select the filter criteria(table name column). This slicer will act as the mechanism to change the data displayed in your table visual.


Best Regards,

Stephen Tao


If this post helps, then please consider Accept it as the solution to help the other members find it more quickly.           

123abc
Community Champion
Community Champion

Create a new calculated table in Power BI using DAX. You can use the SWITCH function along with values from the selected slicer to determine which table to display.


DynamicTable =
SWITCH (
SELECTEDVALUE('SlicerTable'[TableType]),
"T1", 'Table1',
"T2", 'Table2',
"T3", 'Table3',
// Add more conditions as needed
BLANK()
)


Replace 'SlicerTable' with the actual name of your slicer table and 'Table1', 'Table2', etc., with the actual names of your data tables.


If this post helps, then please consider Accepting it as the solution to help the other members find it more quickly.


In case there is still a problem, please feel free and explain your issue in detail, It will be my pleasure to assist you in any way I can.

Helpful resources

Announcements
Fabric Community Sticker Design Challenge Barcelona Carousel

Fabric Community Sticker Challenge - Barcelona 2026

If you love stickers, then you will definitely want to check out our community sticker challenge, Barcelona edition!

July Power BI Update Carousel

Power BI Monthly Update - July 2026

Check out the July 2026 Power BI update to learn about new features.

Power BI DataViz World Championships carousel

Power BI DataViz World Championships - June 2026

A new Power BI DataViz World Championship is coming this June! Don't miss out on submitting your entry.

Top Solution Authors