cancel
Showing results for 
Search instead for 
Did you mean: 

July 7 - July 17 | Round 2 of the Power BI Dataviz World Championships. Don't miss your chance! Learn more

Reply
Anonymous
Not applicable

Dynamic Matrix - Add Column with % Change, with Dynamic Date filter

Hi, My first post and a very new to PowerBi (So be gentle!)
I have looked through a number of similar posts that have not really made things clear, so any help in the right direction would be appreciated.

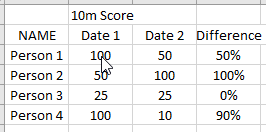
I am looking to create the following simple table using a dynamic matrix

DanLo_3-1664448860175.png

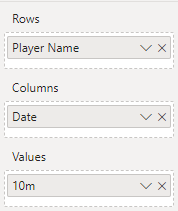
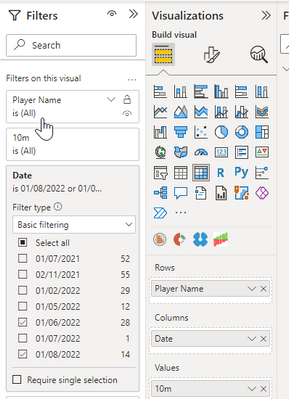
I have successfully created the dynamic matrix, which I can populate with data from the 2 dates in the visuals filter using the below.

DanLo_5-1664449603139.pngDanLo_6-1664449822017.png
However, i would like to add a 3rd column with the % change between the data on the two selected dates, which will not always be the same dates.

The data for this dynamic matrix is being stored in one excel file, where new data is added regularly under multiple names, and on multiple dates.

For example
Micky Mouses data is in Red
Donald Ducks data is in Blue etc

DanLo_4-1664449283534.png


I would like the 2 dates to be changeable by filter on the visual, which i have managed to create.

I would just like some advice on how to add the 3rd additional column with a percentage difference between the first two dynamic columns.


If you would like me to provide any further info just let me know
Thank you in advance,


3 REPLIES 3
davehus
Memorable Member
Memorable Member

Hi @Anonymous ,


Can you provide a screenshot of your model and how the data filters are set up on your report?


Did I help you today? Please accept my solution and hit the Kudos button.

Apologies for the late reply, i had some trouble getting in to my account!

So model looks like this, All of the data is being pulled from PDPRawdata at the moment, which is an excel file.

DanLo2_0-1664783595088.png


Data filters look as follows on the report

DanLo2_1-1664783693281.png

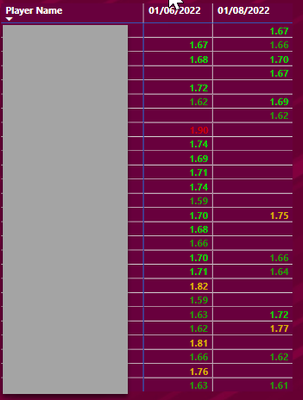
And this is how the report, dynamic matrix currently looks

DanLo2_2-1664783725387.png


Really appreciate you taking a look.

Anonymous
Not applicable

Helpful resources

Announcements
FabCon and SQLCon Barcelona 2026

FabCon & SQLCon – Barcelona 2026

Join us in Barcelona for FabCon and SQLCon, the Fabric, Power BI, SQL, and AI community event. Save €200 with code FABCMTY200.

Fabric Community Sticker Design Challenge Barcelona Carousel

Fabric Community Sticker Challenge - Barcelona 2026

If you love stickers, then you will definitely want to check out our community sticker challenge, Barcelona edition!

July Power BI Update Carousel

Power BI Monthly Update - July 2026

Check out the July 2026 Power BI update to learn about new features.

Power BI DataViz World Championships carousel

Power BI DataViz World Championships - June 2026

A new Power BI DataViz World Championship is coming this June! Don't miss out on submitting your entry.

Top Solution Authors