This is best Fabric, Power BI, SQL and AI community event. How do we know? The last event sold out! Save €200 with code FABCMTY200.
Register nowThe Fabric community is upgrading! Read all of the details including the timeline and what you can expect. Learn more
Hi everybody ! How are you?
I need to do a dynamic histogram where the value is a measure. It is a possible?
Basically, I need a histogram that is based on a measurement and that changes according to the selected date slicer changes.
The example would be as follows:
I have a measurement ranging from -100% to 100% and I need to group stores with values from -100% to 100% in 10% intervals.
Thanks !
Regards!
Solved! Go to Solution.
Hi @Anonymous ,
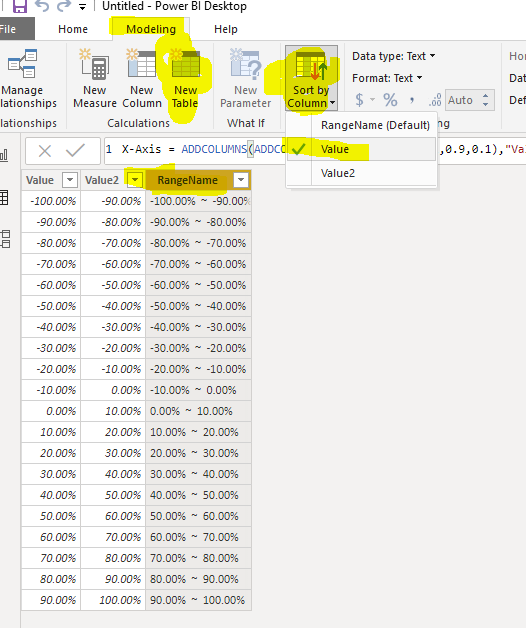
First of all, We can create a calculated table as the Axis:
X-Axis =
ADDCOLUMNS (
ADDCOLUMNS ( GENERATESERIES ( -1, 0.9, 0.1 ), "Value2", [Value] + 0.1 ),
"RangeName", FORMAT ( [Value], "Percent" ) & " ~ "
& FORMAT ( [Value2], "Percent" )
)
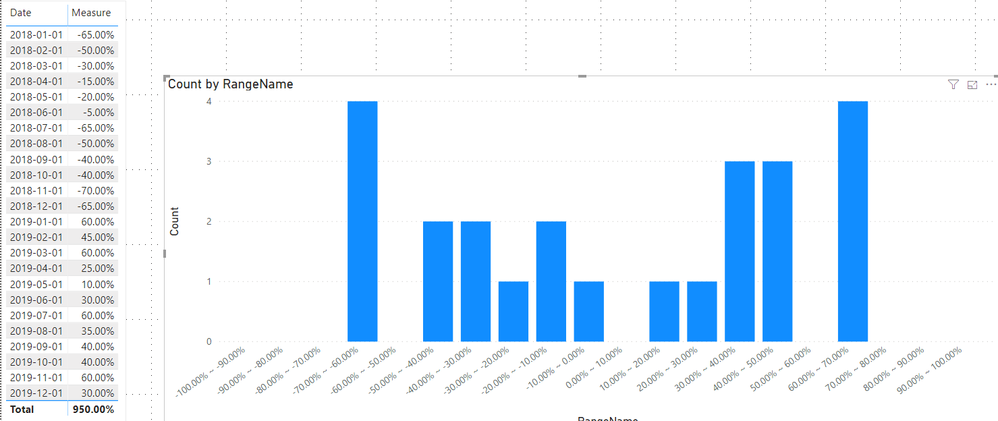
Then we can create a measure to count the value dynamicly
Count =
COUNTROWS (
FILTER (
'Table',
[Measure] >= MIN ( 'X-Axis'[Value] )
&& [Measure] <= MAX ( 'X-Axis'[Value2] )
)
)
If it doesn't meet your requirement, kindly share your sample data and expected result to me if you don't have any Confidential Information. Please upload your files to One Drive and share the link here.
Best regards,
Hi guys,
great and clear example. I have an additional question: I have build a distribution measure as suggested, however it seems to be ignoring any date filters I am applying. Any thoughts how I can make it reactive to changes in the date filter? Good to know the measure draws it's data from a different table than the one the COUNTROWS is applied to.
Hi @Anonymous ,
First of all, We can create a calculated table as the Axis:
X-Axis =
ADDCOLUMNS (
ADDCOLUMNS ( GENERATESERIES ( -1, 0.9, 0.1 ), "Value2", [Value] + 0.1 ),
"RangeName", FORMAT ( [Value], "Percent" ) & " ~ "
& FORMAT ( [Value2], "Percent" )
)
Then we can create a measure to count the value dynamicly
Count =
COUNTROWS (
FILTER (
'Table',
[Measure] >= MIN ( 'X-Axis'[Value] )
&& [Measure] <= MAX ( 'X-Axis'[Value2] )
)
)
If it doesn't meet your requirement, kindly share your sample data and expected result to me if you don't have any Confidential Information. Please upload your files to One Drive and share the link here.
Best regards,
to avoid a value that lies on the edge of a category being counted in both the the lower and higher categories, I recommend changing the count measure from
Count =
COUNTROWS (
FILTER (
'Table',
[Measure] >= MIN ( 'X-Axis'[Value] )
&& [Measure] <= MAX ( 'X-Axis'[Value2] )
)
)
to
Count =
COUNTROWS(
FILTER(
'Table',
[Measure]
> MIN( 'X-Axis'[Value] )
&& [Measure]
<= MAX( 'X-Axis'[Value2] )
)
)
Join us in Barcelona for FabCon and SQLCon, the Fabric, Power BI, SQL, and AI community event. Save €200 with code FABCMTY200.
| User | Count |
|---|---|
| 24 | |
| 22 | |
| 20 | |
| 18 | |
| 14 |
| User | Count |
|---|---|
| 29 | |
| 22 | |
| 22 | |
| 20 | |
| 20 |