This is best Fabric, Power BI, SQL and AI community event. How do we know? The last event sold out! Save €200 with code FABCMTY200.
Register nowA new Data Days event is coming soon! This time we’re going bigger than ever. Fabric, Power BI, SQL, AI and more. Don't miss out.
Hi @Anonymous ,
Are you saying that if i select 5% in slicer it will returen both value * (1+5%) and value * (1-5%), if i select 10% in slicer it will returen both value * (1+10%) and value * (1-10%)?
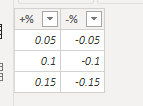
If so you could create a table and measures as below.
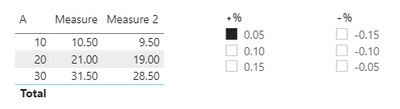
Measure = SELECTEDVALUE('Table'[A])*(1+SELECTEDVALUE(slicer[+%]))
Measure 2 = SELECTEDVALUE('Table'[A])*(1+SELECTEDVALUE(slicer[-%]))
Result would be shown as below.
If i misunderstood your meaning, please show more details.
Best Regards,
Jay
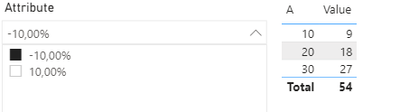
@Anonymous so I did create a table to show something similar to what you have done. Let's say I have a KeyID associated for every record in that table, so I want to first select a single KeyID and when I do that I want a Slicer that can represent lower bound (Measure) and the upper bound (Measure 2)
Something like this
For now, the slicer is not Dynamic, it just gets the Max and Min value of Column A. Would be nice to have it dynamic.
@Anonymous , if the slicer is on % column
measure =
var _max =selectedvalue(slicer[value])
return
calculate(sum(Table[A])*(1+_max))
Absolute number
measure =
var _max =selectedvalue(slicer[value])
return
calculate(sum(Table[A])*((1+_max)//100))
Check out the May 2026 Power BI update to learn about new features.
Sign up to receive a private message when registration opens and key events begin.
If you have recently started exploring Fabric, we'd love to hear how it's going. Your feedback can help with product improvements.
| User | Count |
|---|---|
| 30 | |
| 26 | |
| 25 | |
| 22 | |
| 13 |
| User | Count |
|---|---|
| 58 | |
| 50 | |
| 26 | |
| 20 | |
| 19 |