Get certified for free when you join Fabric Data Days 2026 and dive into Fabric, Power BI, SQL, AI, and other essential data skills.
Join nowJuly 7 - July 17 | Round 2 of the Power BI Dataviz World Championships. Don't miss your chance! Learn more
Hey guys, do you have a workaround to dynamicly toggle the "Color Direction" option in a KPI? I have a table where depending on a flag some records will be displayed as "High is good" but some others should display as "Low is good".
Thanks for your help!
@zbalder,
Could you please share dummy data of your table and display these good records here?
Regards,
Lydia
Hi Lydia,
Here is some sample data, the idea is that the user will have a drop down (slicer) with the codes in it and select each code to see different charts and info about how each code is doing over time, the Dim table has the Code Name, Type of Code and Target Goal, the Fact table has the Amount and the Date.
| Code | Amount | Target Goal | Type of Code |
| # of registrations | 5 | 4 | Good is high |
| # of cancellations | 3 | 1 | Good is low |
| # of applications | 6 | 8 | Good is high |
| # of rejections | 2 | 1 | Good is low |
So for example when the user selects "# of registrations" I want my KPI to look Green (Good color) as 5 is over the Target and Good is high.
But when the users select "# of cancellations" I want to the KPI to look Red (Bad Color) as 3 is over the Target Goal of 1, or if there were 0 # of cancellations then it will display Green (Good Color) as the value would be under the Target.
Does that make sense?
Thanks!
@zbalder,
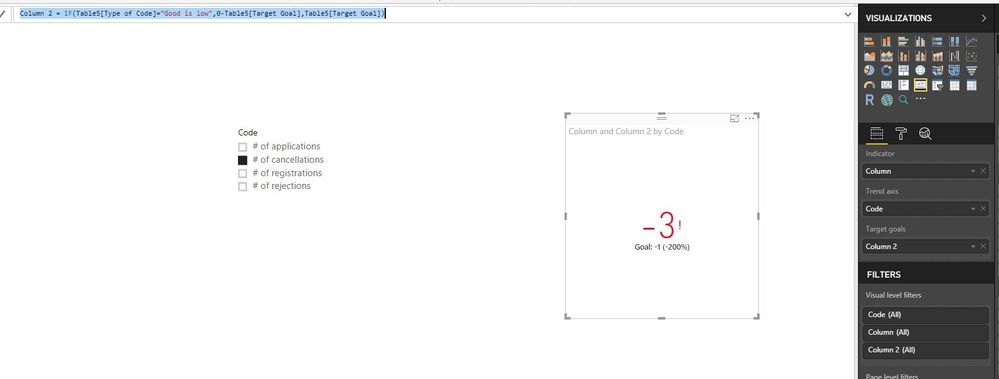
A workaround is to create the following columns in your table and create KPI as follows.
Column = IF(Table[Type of Code]="Good is low",0-Table[Amount],Table[Amount])
Column 2 = IF(Table[Type of Code]="Good is low",0-Table[Target Goal],Table[Target Goal])
Regards,
Lydia
Thanks Lydia, I had thought about this solution, but displaying negative values in the KPI won't be an acceptable visual for the user, I think there is no way, do you know how easy will it be to modify the current KPI Visual to accept a field in the Direction option?
Join us in Barcelona for FabCon and SQLCon, the Fabric, Power BI, SQL, and AI community event. Save €200 with code FABCMTY200.
Join Data Days 2026: 60 days of free live/on-demand sessions, challenges, study groups, and certification opportunities.
| User | Count |
|---|---|
| 28 | |
| 23 | |
| 18 | |
| 18 | |
| 15 |
| User | Count |
|---|---|
| 47 | |
| 44 | |
| 43 | |
| 35 | |
| 30 |