Join us at the 2025 Microsoft Fabric Community Conference
March 31 - April 2, 2025, in Las Vegas, Nevada. Use code MSCUST for a $150 discount! Early bird discount ends December 31.
Register Now- Power BI forums
- Get Help with Power BI
- Desktop
- Service
- Report Server
- Power Query
- Mobile Apps
- Developer
- DAX Commands and Tips
- Custom Visuals Development Discussion
- Health and Life Sciences
- Power BI Spanish forums
- Translated Spanish Desktop
- Training and Consulting
- Instructor Led Training
- Dashboard in a Day for Women, by Women
- Galleries
- Community Connections & How-To Videos
- COVID-19 Data Stories Gallery
- Themes Gallery
- Data Stories Gallery
- R Script Showcase
- Webinars and Video Gallery
- Quick Measures Gallery
- 2021 MSBizAppsSummit Gallery
- 2020 MSBizAppsSummit Gallery
- 2019 MSBizAppsSummit Gallery
- Events
- Ideas
- Custom Visuals Ideas
- Issues
- Issues
- Events
- Upcoming Events
Be one of the first to start using Fabric Databases. View on-demand sessions with database experts and the Microsoft product team to learn just how easy it is to get started. Watch now
- Power BI forums
- Forums
- Get Help with Power BI
- Desktop
- Re: Display continuous line in area chart
- Subscribe to RSS Feed
- Mark Topic as New
- Mark Topic as Read
- Float this Topic for Current User
- Bookmark
- Subscribe
- Printer Friendly Page
- Mark as New
- Bookmark
- Subscribe
- Mute
- Subscribe to RSS Feed
- Permalink
- Report Inappropriate Content
Display continuous line in area chart
Hi everyone.
I've got this area chart:
On the X axis I put the calendary date, that is connected to all tables.
The orange measure represents the total sales per month for the selected item and it is a continuous line. The blue line represents the price of the same item paid to the suppliers and the purple line represents another kind of cost.
As you can see, the blue and purple line are not continuous, but they are visible only for the months in which there are some rows of purchases from the suppliers.
How can I show continuous lines also for these two fields? The ideal result would be:
So, for the months in which I have no purchases from the suppliers, I would like to see the last available price.
Thank you for the help.
Solved! Go to Solution.
- Mark as New
- Bookmark
- Subscribe
- Mute
- Subscribe to RSS Feed
- Permalink
- Report Inappropriate Content
I managed to do it by using the field 'Date' instead of 'Date hierarchy' as x axis, setting 'continuous' type as parameter.
- Mark as New
- Bookmark
- Subscribe
- Mute
- Subscribe to RSS Feed
- Permalink
- Report Inappropriate Content
I managed to do it by using the field 'Date' instead of 'Date hierarchy' as x axis, setting 'continuous' type as parameter.
- Mark as New
- Bookmark
- Subscribe
- Mute
- Subscribe to RSS Feed
- Permalink
- Report Inappropriate Content
I am looking for the option to show continuously but it is not in the x or y options. could you show a photo please
- Mark as New
- Bookmark
- Subscribe
- Mute
- Subscribe to RSS Feed
- Permalink
- Report Inappropriate Content
Hi,
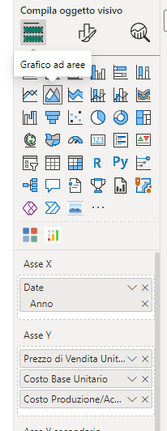
I'm using PowerBI in italian, btw i chose this visual:
and I set the option "Continuous" in this part:
- Mark as New
- Bookmark
- Subscribe
- Mute
- Subscribe to RSS Feed
- Permalink
- Report Inappropriate Content
Hey @mtrevisiol ,
you can use a cumulative function like DATESBETWEEN to get values for each day.
- Mark as New
- Bookmark
- Subscribe
- Mute
- Subscribe to RSS Feed
- Permalink
- Report Inappropriate Content
@selimovd thank you for the answer, could you explain more in detail how DATESBETWEEN can be useful for my purpose? Thanks.
Helpful resources

Join us at the Microsoft Fabric Community Conference
March 31 - April 2, 2025, in Las Vegas, Nevada. Use code MSCUST for a $150 discount!

We want your feedback!
Your insights matter. That’s why we created a quick survey to learn about your experience finding answers to technical questions.

Microsoft Fabric Community Conference 2025
Arun Ulag shares exciting details about the Microsoft Fabric Conference 2025, which will be held in Las Vegas, NV.

| User | Count |
|---|---|
| 123 | |
| 85 | |
| 85 | |
| 70 | |
| 51 |
| User | Count |
|---|---|
| 205 | |
| 153 | |
| 97 | |
| 79 | |
| 69 |


