Get certified for free when you join Fabric Data Days 2026 and dive into Fabric, Power BI, SQL, AI, and other essential data skills.
Join nowJuly 28 - August 9 | Final Round of the Power BI Dataviz World Championships. This is your chance. Learn more
Hi,
May I ask you if there is a possible way to do the same but for the decrease?
If the code appears today but no longer tomorrow I want it to reflect it as a negative.
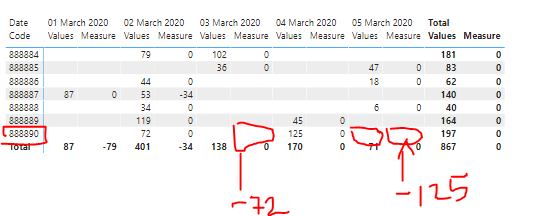
Here I attached an example:
For example the code 888890 had value 72 for March 2nd, but it didn't have any values on March 3rd So i want the measure to return a -72 On March 3rd. An d the same case for March 4th and 5th returning a -125. So that the measure now instead of giving me the total sum for thos positive values I want it to give me only the sum for the negative ones.
Hope this is possible!
Thanks in advance.
Solved! Go to Solution.
Hi,
According to your description, Please try this measure:
Measure =
VAR a =
CALCULATE (
SUM ( 'Table'[Values] ),
FILTER (
ALLSELECTED ( 'Table'[Date] ),
'Table'[Date]
= CALCULATE (
MAX ( 'Table'[Date] ),
FILTER (
ALLSELECTED ( 'Table' ),
'Table'[Date] < MIN ( 'Table'[Date] )
&& 'Table'[Date Code] IN DISTINCT ( 'Table'[Date Code] )
)
)
)
)
RETURN
IF (
a = BLANK (),
IF ( MAX ( 'Table'[Values] ) = BLANK (), BLANK (), 0 ),
SUM ( 'Table'[Values] ) - a
)The result shows:
Here is my test pbix file:
Hope this helps.
Best Regards,
Giotto Zhi
Hi,
According to your description, Please try this measure:
Measure =
VAR a =
CALCULATE (
SUM ( 'Table'[Values] ),
FILTER (
ALLSELECTED ( 'Table'[Date] ),
'Table'[Date]
= CALCULATE (
MAX ( 'Table'[Date] ),
FILTER (
ALLSELECTED ( 'Table' ),
'Table'[Date] < MIN ( 'Table'[Date] )
&& 'Table'[Date Code] IN DISTINCT ( 'Table'[Date Code] )
)
)
)
)
RETURN
IF (
a = BLANK (),
IF ( MAX ( 'Table'[Values] ) = BLANK (), BLANK (), 0 ),
SUM ( 'Table'[Values] ) - a
)The result shows:
Here is my test pbix file:
Hope this helps.
Best Regards,
Giotto Zhi
If you love stickers, then you will definitely want to check out our community sticker challenge, Barcelona edition!
Check out the July 2026 Power BI update to learn about new features.
| User | Count |
|---|---|
| 26 | |
| 23 | |
| 22 | |
| 20 | |
| 18 |
| User | Count |
|---|---|
| 35 | |
| 28 | |
| 21 | |
| 19 | |
| 17 |