This is best Fabric, Power BI, SQL and AI community event. How do we know? The last event sold out! Save €200 with code FABCMTY200.
Register nowA new Data Days event is coming soon! This time we’re going bigger than ever. Fabric, Power BI, SQL, AI and more. Don't miss out.
Hello All...
I actually have 2 date related questions.
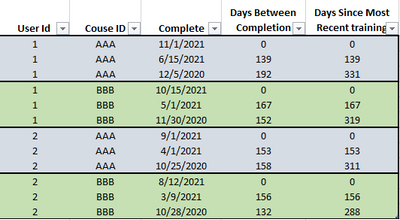
I have a training database. There are three columns. UserID, CourseID, CompleteDate. The database is sorted by UserID then CourseId then CompleteDate descending.
1. I need a column that shows the number of days between each completedate.
2. I need a coulmn that shows the number of days between the completed date and MOST RECENT COMPLETE DATE.
I need the calculation to change for each couse, and then for each UserID
Thanks everyone.
Solved! Go to Solution.
Hi @amtrakrob ,
Please try the following formula to create columns:
Rank = RANKX(FILTER('Table',[User Id]=EARLIER('Table'[User Id]) && [Course ID]=EARLIER('Table'[Course ID])),[Complete],,DESC)Days Between Completion =
var _pre=CALCULATE(MAX('Table'[Complete]),FILTER('Table',[User Id]=EARLIER('Table'[User Id]) && [Course ID]=EARLIER('Table'[Course ID]) && [Rank]=EARLIER('Table'[Rank])-1))
return DATEDIFF([Complete],_pre,DAY)+0Days Since Most Recent Training = SUMX(FILTER('Table',[User Id]=EARLIER('Table'[User Id]) && [Course ID]=EARLIER('Table'[Course ID]) && [Complete]>=EARLIER('Table'[Complete])),[Days Between Completion])
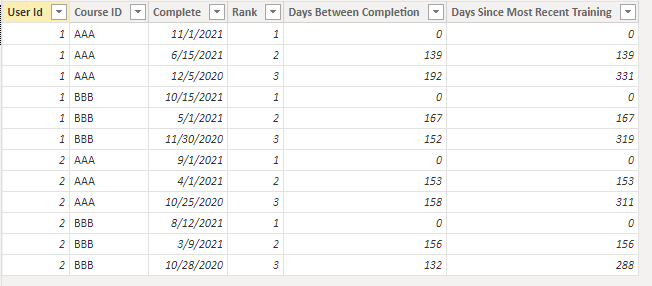
Output:
Best Regards,
Eyelyn Qin
If this post helps, then please consider Accept it as the solution to help the other members find it more quickly
Hi @amtrakrob ,
Please try the following formula to create columns:
Rank = RANKX(FILTER('Table',[User Id]=EARLIER('Table'[User Id]) && [Course ID]=EARLIER('Table'[Course ID])),[Complete],,DESC)Days Between Completion =
var _pre=CALCULATE(MAX('Table'[Complete]),FILTER('Table',[User Id]=EARLIER('Table'[User Id]) && [Course ID]=EARLIER('Table'[Course ID]) && [Rank]=EARLIER('Table'[Rank])-1))
return DATEDIFF([Complete],_pre,DAY)+0Days Since Most Recent Training = SUMX(FILTER('Table',[User Id]=EARLIER('Table'[User Id]) && [Course ID]=EARLIER('Table'[Course ID]) && [Complete]>=EARLIER('Table'[Complete])),[Days Between Completion])
Output:
Best Regards,
Eyelyn Qin
If this post helps, then please consider Accept it as the solution to help the other members find it more quickly
PERFECT!!!!!!
Thank you!
Sorry... I should have said. I'm doing this in Power BI, and then these to be columns on my visual.
Check out the May 2026 Power BI update to learn about new features.
Sign up to receive a private message when registration opens and key events begin.
If you have recently started exploring Fabric, we'd love to hear how it's going. Your feedback can help with product improvements.
| User | Count |
|---|---|
| 32 | |
| 26 | |
| 25 | |
| 24 | |
| 15 |
| User | Count |
|---|---|
| 63 | |
| 48 | |
| 27 | |
| 23 | |
| 20 |