Get certified for free when you join Fabric Data Days 2026 and dive into Fabric, Power BI, SQL, AI, and other essential data skills.
Join nowJuly 28 - August 9 | Final Round of the Power BI Dataviz World Championships. This is your chance. Learn more
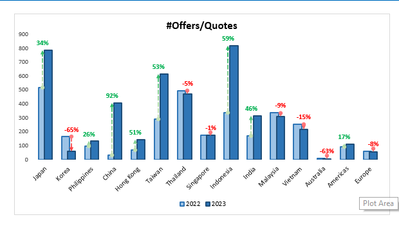
I have append table of 2022 and 2023 years from week 25 to week 31 and had column of Tour request number a as appended table ,but I want to show only week 31 data of 2023 and same period in last year of 2022 by sales offices and Y axis should contain no of tour request number in clustered column chart in power bi. what should I do to prepare clustered column chart.
Which DAX function Should I use to do this. The below chart is from EXCEl..I want do same in power bi desktop
Plese Hep me
Make sure you have separate date/week table with Year, Week , YearWeek (YYYYWW)
Have column like this in Date/week Table
Week Rank = RANKX('Date','Date'[Year Week],,ASC,Dense) //YYYYWW format
These measures can help
This Week = CALCULATE(sum('Table'[Qty]), FILTER(ALL('Date'),'Date'[Week Rank]=max('Date'[Week Rank])))
Last Week = CALCULATE(sum('Table'[Qty]), FILTER(ALL('Date'),'Date'[Week Rank]=max('Date'[Week Rank])-1))
Last Year Same Week = CALCULATE(sum('Table'[Qty]), FILTER(ALL('Date'),'Date'[Year]=max('Date'[Year])-1 && 'Date'[Week] = Max('Date'[Week])))
With date table you can also use
week Year behind Sales = CALCULATE(SUM(Sales[Sales Amount]),dateadd('Date'[Date],-364,DAY))
Power BI — Week on Week and WTD
https://medium.com/@amitchandak.1978/power-bi-wtd-questions-time-intelligence-4-5-98c30fab69d3
https://community.powerbi.com/t5/Community-Blog/Week-Is-Not-So-Weak-WTD-Last-WTD-and-This-Week-vs-La...
https://www.youtube.com/watch?v=pnAesWxYgJ8
Time Intelligence, Part of learn Power BI https://youtu.be/cN8AO3_vmlY?t=27510
Power BI — WTD Questions— Time Intelligence 4–5
In this blog, we will try to answer, 10 Most Frequently Asked Questions on Week Till Date(WTD) in Power BI.
No its not working ,
I have append table of 2022 and 2023 years week wise ,but I want to show only week 31 data of 2023 and same period in last year of 2022 by sales offices should be on X axis and Y axis should contain no of tour request number and Legend field should contain year column in clustered column chart in power bi without filtering data. what should I do to prepare clustered column chart. which DAX function shoud I use
Make sure you have separate date/week table with Year, Week , YearWeek (YYYYWW)
Have column like this in Date/week Table
Week Rank = RANKX('Date','Date'[Year Week],,ASC,Dense) //YYYYWW format
These measures can help
This Week = CALCULATE(sum('Table'[Qty]), FILTER(ALL('Date'),'Date'[Week Rank]=max('Date'[Week Rank])))
Last Week = CALCULATE(sum('Table'[Qty]), FILTER(ALL('Date'),'Date'[Week Rank]=max('Date'[Week Rank])-1))
Last Year Same Week = CALCULATE(sum('Table'[Qty]), FILTER(ALL('Date'),'Date'[Year]=max('Date'[Year])-1 && 'Date'[Week] = Max('Date'[Week])))
With date table you can also use
week Year behind Sales = CALCULATE(SUM(Sales[Sales Amount]),dateadd('Date'[Date],-364,DAY))
Power BI — Week on Week and WTD
https://medium.com/@amitchandak.1978/power-bi-wtd-questions-time-intelligence-4-5-98c30fab69d3
https://community.powerbi.com/t5/Community-Blog/Week-Is-Not-So-Weak-WTD-Last-WTD-and-This-Week-vs-La...
https://www.youtube.com/watch?v=pnAesWxYgJ8
Time Intelligence, Part of learn Power BI https://youtu.be/cN8AO3_vmlY?t=27510
@Anonymous Please try this measure.
If you love stickers, then you will definitely want to check out our community sticker challenge, Barcelona edition!
Check out the July 2026 Power BI update to learn about new features.
| User | Count |
|---|---|
| 30 | |
| 28 | |
| 23 | |
| 21 | |
| 19 |
| User | Count |
|---|---|
| 41 | |
| 32 | |
| 18 | |
| 18 | |
| 15 |