This time we’re going bigger than ever. Fabric, Power BI, SQL, AI and more. We're covering it all. You won't want to miss it.
Learn moreLevel up your Power BI skills this month - build one visual each week and tell better stories with data! Get started
Hello everyone,
I am working on a matrix which contains a measure that's a % calculation using two other measures.
% Funded = DIVIDE([Approved apps],[Total Apps])
I then created a matrix of the [% Funded] based on Purpose( in rows) and CreditLevel (in columns) resuting in below matrix format (subtotals and grand totals removed):
| Purpose | SubPrime | Prime5 | Prime6 | Superprime |
| Auto | 5% | 3.4% | 8% | 5% |
| DebtConsol | 4.6% | 4.8% | 6% | 10% |
| HomeImprovement | 8% | 3.5% | 3.8% | 4.6% |
| Others | 9.4% | 9% | 3.4% | 8% |
What I am looking for is that the above %s to change such that I have the row total percentage and column total percentage to be 100% each from the above %values.
I do know if the cell values were numbers ( eg: [Total apps]), I could have used a DAX formula given below for column totals to end up 100%, but its not working for a measure that's a percentage itself:
1 2 3 4 5 6 | % of CreditTier on Rows = DIVIDE ( [Total Apps], CALCULATE ( [Total Apps], ALLSELECTED( 'Table'[Purpose] ) ) ) |
Please do let me know if I need to add any more info to resolve this.
Thanks in advance.
Solved! Go to Solution.
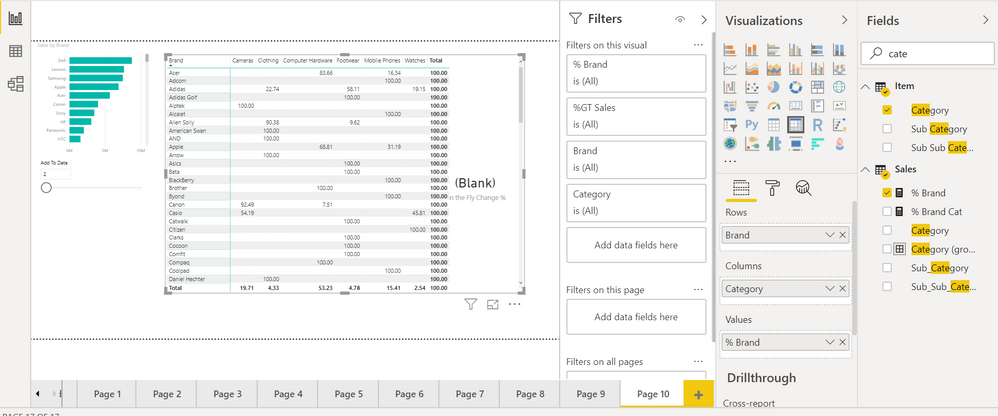
Check
% Brand =
CALCULATE ( SUM ( Sales[Sales] ) )
/ CALCULATE (
SUM ( Sales[Sales] ),
ALLEXCEPT ( 'Item','Item'[Brand])
)*100I have a report listing invoices with multiple sales. The invoice is listed 3 times and the tax lines are the same so I have a column:
@Anonymous ,
The info you gived is not complete, could you please also share measures [Approved apps], [Total Apps]. If possible, please also give the expected output.
Regards,
Jimmy Tao
[Approved] := calculate(distinctcount(AppdId),FILTER(distinct(Data[SubmittedDate]),
[SubmittedDate] >= MIN(dCalender[DimDateKey]) && [SubmittedDate] <= MAX(dCalender[DimDateKey]) && [IsApproved] =1))
[Total Apps] := calculate(distinctcount(AppdId),FILTER(distinct(Data[SubmittedDate]),
[SubmittedDate] >= MIN(dCalender[DimDateKey]) && [SubmittedDate] <= MAX(dCalender[DimDateKey])))
Expected output matrix:
| Purpose | SubPrime | Prime5 | Prime6 | Superprime | Expected Total |
| Auto | 20% | 40% | 32% | 8% | 100% |
| DebtConsol | 15% | 35% | 20% | 30% | 100% |
| HomeImprovement | 10% | 30% | 40% | 20% | 100% |
| Others | 40% | 25% | 30% | 5% | 100% |
So, if the total count of Funded (since the intial % was for funded) is 100; suppose, 25 of them are Auto ( as purpose), then this 25 is spilt into the four credit levels ( eg: #Subprime - 5, #Prime5 - 10, #Prime6 - 8 and #Superprime: 2, which totals 25). So, the row totals have to end up to 100% ( i.e. Subprime: 5/25 = 20%, Prime5: 10/25 = 40%, Prime6: 8/25 =32%, Superprime: 2/25 =8%).
I hope I was able to explain it. Similarly, I want to do the same at the column level as well.
Check out the April 2026 Power BI update to learn about new features.
Sign up to receive a private message when registration opens and key events begin.
If you have recently started exploring Fabric, we'd love to hear how it's going. Your feedback can help with product improvements.
| User | Count |
|---|---|
| 31 | |
| 25 | |
| 21 | |
| 18 | |
| 17 |
| User | Count |
|---|---|
| 62 | |
| 34 | |
| 33 | |
| 24 | |
| 23 |