This is best Fabric, Power BI, SQL and AI community event. How do we know? The last event sold out! Save €200 with code FABCMTY200.
Register nowJuly 28 - August 9 | Final Round of the Power BI Dataviz World Championships. This is your chance. Learn more
I have a large data set with Date and Status. Status includes Assigned, In Progress and Complete. I want to create a dynamic summary of the count of Complete and Total by Month. The total will be the count of all statuses. Then I can calculate the percentage of how much progress is made in each specific month (Complete divided by Total).
Desired Result of Summary table:
| Month | Complete | Total | % |
| Jan | 0 | 1600 | 0% |
| Feb | 600 | 2700 | 22.22% |
| Mar | 400 | 3000 | 13.33% |
Any suggestions?
P.S. I'm not an advanced user.
Solved! Go to Solution.
@user900 , for the First three columns use Group by of Power Query, and for % create a measure in DAX
Divide(Sum(Table[Complete]), Sum(Table[Total]) )
https://learn.microsoft.com/en-us/power-query/group-by
Hi,
Try this approach
Total = countrows(Data)
Complete = calculate([Total],Data[Status]="Complete")
Complete (%) = divide([Complete],[Total])
Hope this helps.
Hi @user900
Thanks for the solution @amitchandak provided and I want to offer some more information for you to refer to.
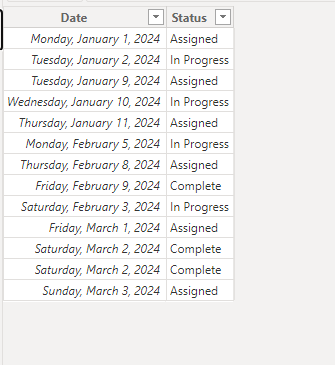
Sample data
Create the following measures
Complete =
VAR a =
CALCULATE ( COUNTROWS ( 'Table' ), 'Table'[Status] = "Complete" )
RETURN
IF ( a > 0, a, IF ( [Total] > 0, 0 ) )
Total = COUNTA('Table'[Status])% = DIVIDE([Complete],[Total])
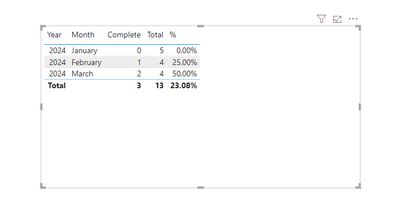
Then put the measures to a table visual.
Output
Best Regards!
Yolo Zhu
If this post helps, then please consider Accept it as the solution to help the other members find it more quickly.
@user900 , for the First three columns use Group by of Power Query, and for % create a measure in DAX
Divide(Sum(Table[Complete]), Sum(Table[Total]) )
Join us in Barcelona for FabCon and SQLCon, the Fabric, Power BI, SQL, and AI community event. Save €200 with code FABCMTY200.
If you love stickers, then you will definitely want to check out our community sticker challenge, Barcelona edition!
Check out the July 2026 Power BI update to learn about new features.
| User | Count |
|---|---|
| 25 | |
| 23 | |
| 20 | |
| 18 | |
| 14 |
| User | Count |
|---|---|
| 24 | |
| 20 | |
| 20 | |
| 19 | |
| 18 |