This is best Fabric, Power BI, SQL and AI community event. How do we know? The last event sold out! Save €200 with code FABCMTY200.
Register nowThe Fabric community is upgrading! Read all of the details including the timeline and what you can expect. Learn more
Hallo,
i want to create a line chart based on Sharepoint List.
In the Χ Axis i want to use Value1 Value2 Value3
On the Y Axis I only want to use LWIF data
my List is as follows
| Title | Value1 | Value2 | Value3 | Year |
| Hours | 157 | 171 | 328 | 2019 |
| LWIF | 0.898 | 0,696 | 0,793 | 2019 |
| LW | 5,5 | 2,5 | 8,1 | 2019 |
Can i Filter this column?
I tried to create a quick measure but i get an error.
I have also tried pivot - unpivot and still getting many errors.
How can i create this chart?
Solved! Go to Solution.
Hi @marial16 ,
According to your description, here's my solution.
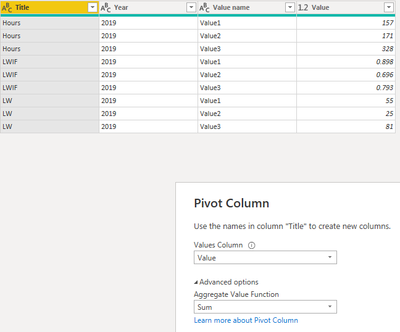
1.In PowerQuery, select Value1 Value2 Value3 columns at the same time, then unpivot columns.
2.Select the Title column then pivot like this.
Get five columns.
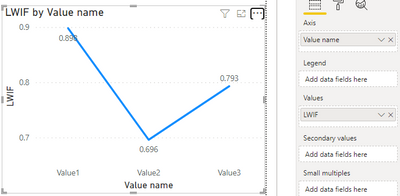
3.In the line chart, put value name in the Axis and LWIF in the Values.
I attach my sample below for reference.
Best Regards,
Community Support Team _ kalyj
If this post helps, then please consider Accept it as the solution to help the other members find it more quickly.
Hi @marial16 ,
According to your description, here's my solution.
1.In PowerQuery, select Value1 Value2 Value3 columns at the same time, then unpivot columns.
2.Select the Title column then pivot like this.
Get five columns.
3.In the line chart, put value name in the Axis and LWIF in the Values.
I attach my sample below for reference.
Best Regards,
Community Support Team _ kalyj
If this post helps, then please consider Accept it as the solution to help the other members find it more quickly.
@marial16 , Check the steps in this code
let
Source = Table.FromRows(Json.Document(Binary.Decompress(Binary.FromText("i45W8sgvLSpW0lEyNDUHkeaGQNLYyAJIGhkYWirF6kQr+YR7ugH5BnoWliBxAx0zSzMwbW5pjKoOyDPVMQWJgUkLHUO4fCwA", BinaryEncoding.Base64), Compression.Deflate)), let _t = ((type nullable text) meta [Serialized.Text = true]) in type table [Title = _t, Value1 = _t, Value2 = _t, Value3 = _t, Year = _t]),
#"Changed Type" = Table.TransformColumnTypes(Source,{{"Title", type text}, {"Value1", type number}, {"Value2", Int64.Type}, {"Value3", Int64.Type}, {"Year", Int64.Type}}),
#"Unpivoted Columns" = Table.UnpivotOtherColumns(#"Changed Type", {"Title", "Year"}, "Attribute", "Value"),
#"Pivoted Column" = Table.Pivot(#"Unpivoted Columns", List.Distinct(#"Unpivoted Columns"[Title]), "Title", "Value", List.Sum)
in
#"Pivoted Column"
Since i had no luck with that, i created the list in a different way.
Rows as Columns .
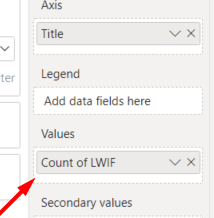
X axis is correct but why am i getting the count of LWIF;
I just want the values
is there an alternative?
Join us in Barcelona for FabCon and SQLCon, the Fabric, Power BI, SQL, and AI community event. Save €200 with code FABCMTY200.
| User | Count |
|---|---|
| 24 | |
| 22 | |
| 20 | |
| 18 | |
| 14 |
| User | Count |
|---|---|
| 45 | |
| 38 | |
| 24 | |
| 21 | |
| 20 |