Get certified for free when you join Fabric Data Days 2026 and dive into Fabric, Power BI, SQL, AI, and other essential data skills.
Join nowJuly 28 - August 9 | Final Round of the Power BI Dataviz World Championships. This is your chance. Learn more
Hi Everyone! I am new here and with Power BI.
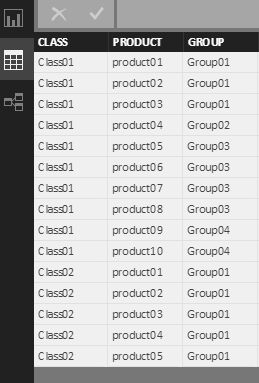
I have a table as follow:
In my report I have I filter where I Select for Class01 or Class02 or both.
I need to count, how many times each [GROUP} row is visible (Only visible values) when I select Class Filter.
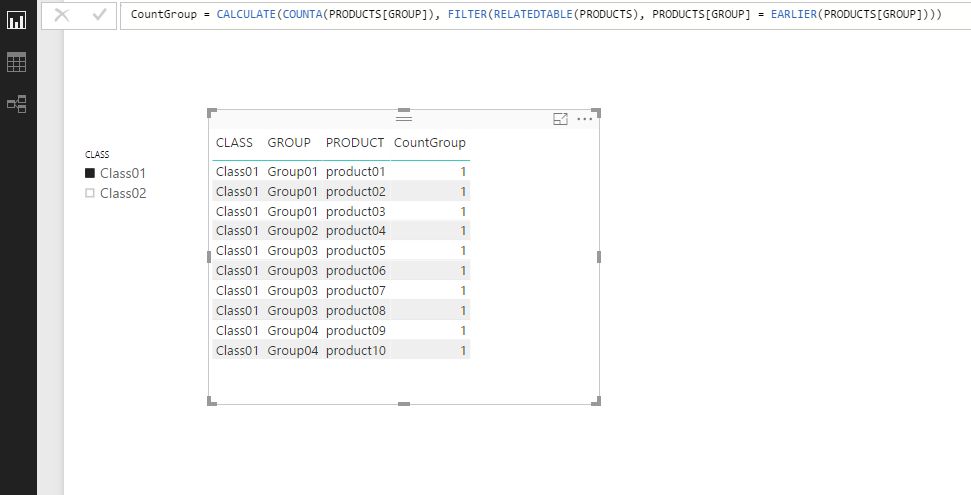
I tried this, with Class01 selected in filter:
CountGroup = CALCULATE(COUNTA(PRODUCTS[GROUP]), FILTER(RELATEDTABLE(PRODUCTS), PRODUCTS[GROUP] = EARLIER(PRODUCTS[GROUP])))
but Dont work, as follow showing only a value 1:
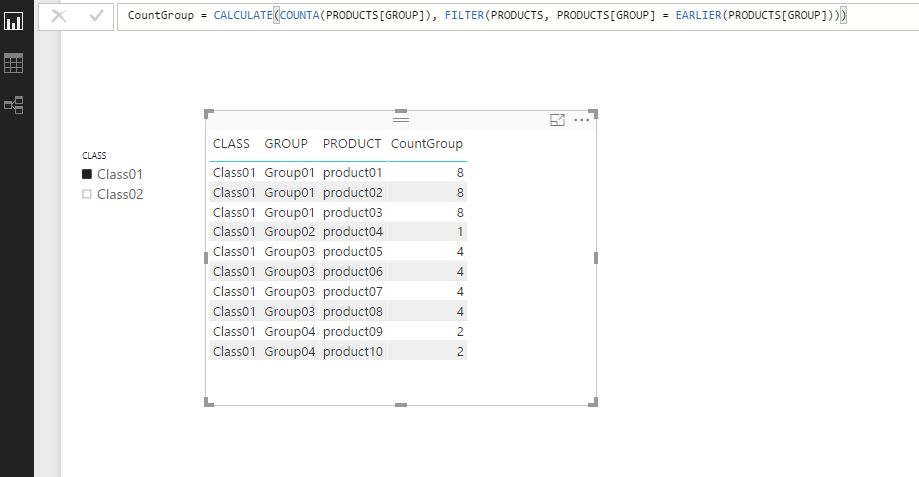
And I tried without RELATED, but it gave me the TOTAL of each Group ocurrences in the original table (8 for three first rows), that is not what I want.
CountGroup = CALCULATE(COUNTA(PRODUCTS[GROUP]), FILTER(PRODUCTS, PRODUCTS[GROUP] = EARLIER(PRODUCTS[GROUP])))
I need this Collumn [CountGroup] result when Class01 is selected in filter:
3
3
3
1
4
4
4
4
2
2
Thanks in advance!
Solved! Go to Solution.
You may use DAX below to add a measure.
CountGroup =
CALCULATE (
COUNT ( PRODUCTS[GROUP] ),
ALLSELECTED ( PRODUCTS[CLASS] ),
ALL ( PRODUCTS[PRODUCT] )
)
You may use DAX below to add a measure.
CountGroup =
CALCULATE (
COUNT ( PRODUCTS[GROUP] ),
ALLSELECTED ( PRODUCTS[CLASS] ),
ALL ( PRODUCTS[PRODUCT] )
)
If you love stickers, then you will definitely want to check out our community sticker challenge, Barcelona edition!
Check out the July 2026 Power BI update to learn about new features.
| User | Count |
|---|---|
| 26 | |
| 22 | |
| 22 | |
| 20 | |
| 18 |
| User | Count |
|---|---|
| 35 | |
| 28 | |
| 21 | |
| 19 | |
| 17 |