Get certified for free when you join Fabric Data Days 2026 and dive into Fabric, Power BI, SQL, AI, and other essential data skills.
Join nowJuly 7 - July 17 | Round 2 of the Power BI Dataviz World Championships. Don't miss your chance! Learn more
Hi,
I have next matrix in Power BI, where I need to add conditional formatting to value in columns Jan-2010:Jun 2010 based on Start Date and End Date columns. For instance, for the first row the color of 13 and 18 should be red, while 13, 19 14, 10 should be green. How can I approach this problem?
| Item 1 | Item 2 | Start Date | End Date | Jan-2010 | Feb-2010 | Mar-2010 | Apr-2010 | May-2010 | Jun-2010 |
| S2 | ik22 | 01/11/2009 | 01/03/2010 | 13 | 18 | 13 | 19 | 14 | 10 |
| S3 | ik23 | 15/10/2009 | 15/02/2010 | 15 | 20 | 12 | 18 | 11 | 11 |
| S4 | ik24 | 01/12/2009 | 20/04/2010 | 13 | 16 | 20 | 11 | 20 | 10 |
| S5 | ik25 | 15/11/2009 | 15/02/2010 | 20 | 10 | 13 | 12 | 15 | 16 |
| S6 | ik26 | 20/12/2009 | 20/05/2010 | 17 | 18 | 17 | 15 | 16 | 15 |
| S7 | ik27 | 23/02/2009 | 23/08/2010 | 16 | 16 | 13 | 20 | 20 | 19 |
Solved! Go to Solution.
Hi @Anonymous
You can do it by creating Measure like below.
Conditional Formatting =
SUMX(
'Table',
INT (
AND(
'Table'[Date] >= 'Table'[Start Date],
'Table'[Date] <= 'Table'[End Date]
)
)
)
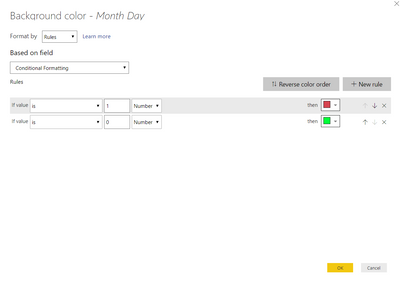
And later using it for Conditional Formating like below.
Hi @Anonymous
You can do it by creating Measure like below.
Conditional Formatting =
SUMX(
'Table',
INT (
AND(
'Table'[Date] >= 'Table'[Start Date],
'Table'[Date] <= 'Table'[End Date]
)
)
)
And later using it for Conditional Formating like below.
Join us in Barcelona for FabCon and SQLCon, the Fabric, Power BI, SQL, and AI community event. Save €200 with code FABCMTY200.
Join Data Days 2026: 60 days of free live/on-demand sessions, challenges, study groups, and certification opportunities.
| User | Count |
|---|---|
| 28 | |
| 23 | |
| 18 | |
| 18 | |
| 15 |
| User | Count |
|---|---|
| 47 | |
| 44 | |
| 43 | |
| 38 | |
| 32 |