This is best Fabric, Power BI, SQL and AI community event. How do we know? The last event sold out! Save €200 with code FABCMTY200.
Register nowJuly 28 - August 9 | Final Round of the Power BI Dataviz World Championships. This is your chance. Learn more
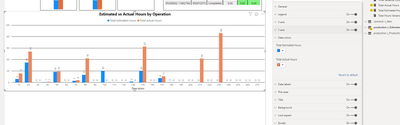
Is there a way to apply condtional color formatting a bar chart that contains 2 data set values? Currently I only see the opition to conditional format bar chart data with 1 value.
Solved! Go to Solution.
Hi @JasonBridges ,
You may submit this as an idea through below link.
https://ideas.powerbi.com/ideas/
Best Regards,
Jay
Hi @JasonBridges ,
You may submit this as an idea through below link.
https://ideas.powerbi.com/ideas/
Best Regards,
Jay
@JasonBridges - Can you post a screen shot of the visual and it's configuration/where you are seeing the 1 color formatting option?
When using single value I can go t o data colors and select conditional formatting (3 dots). However, once I add a 2nd data set the conditional formatting option goes away in the data color options. I am a beginner with coding and have not been able to see if a DAX code will work.
You cannot conditionally apply two bars on the same graph. at the moment Power BI doesn't have that possibility.
You can try two graphs or try store graphs that allow for more customization.
Join us in Barcelona for FabCon and SQLCon, the Fabric, Power BI, SQL, and AI community event. Save €200 with code FABCMTY200.
If you love stickers, then you will definitely want to check out our community sticker challenge, Barcelona edition!
Check out the July 2026 Power BI update to learn about new features.
| User | Count |
|---|---|
| 25 | |
| 23 | |
| 19 | |
| 17 | |
| 14 |
| User | Count |
|---|---|
| 24 | |
| 20 | |
| 20 | |
| 19 | |
| 19 |