This is best Fabric, Power BI, SQL and AI community event. How do we know? The last event sold out! Save €200 with code FABCMTY200.
Register nowThe Fabric community is upgrading! Read all of the details including the timeline and what you can expect. Learn more
Hi All,
I have a column chart visual in which I want to show all the data points without the need to scroll. Is that possible?
Please see the attached screenshot for detail.
Thank you.
Solved! Go to Solution.
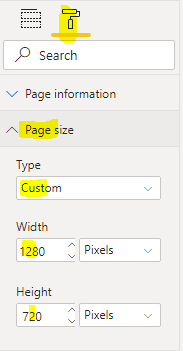
Your only option is to either reduce the column size and padding, or increase the size of the report canvas.
Br,
J
@Anonymous , You can reduce the width of the bar.
You can put the top N filter and reduce the no of data points
or try pagination like
https://www.fourmoo.com/2017/10/31/power-bi-how-to-do-pagination-in-power-bi-reports/
@Anonymous , You can reduce the width of the bar.
You can put the top N filter and reduce the no of data points
or try pagination like
https://www.fourmoo.com/2017/10/31/power-bi-how-to-do-pagination-in-power-bi-reports/
Your only option is to either reduce the column size and padding, or increase the size of the report canvas.
Br,
J
Join us in Barcelona for FabCon and SQLCon, the Fabric, Power BI, SQL, and AI community event. Save €200 with code FABCMTY200.
| User | Count |
|---|---|
| 23 | |
| 22 | |
| 14 | |
| 14 | |
| 13 |
| User | Count |
|---|---|
| 45 | |
| 38 | |
| 24 | |
| 22 | |
| 20 |