
This is best Fabric, Power BI, SQL and AI community event. How do we know? The last event sold out! Save €200 with code FABCMTY200.
Register nowThe Fabric community is upgrading! Read all of the details including the timeline and what you can expect. Learn more
Hello!
I have a sales pipeline and I'm reporting against various different pieces of data. I have a number of bar charts and unforunately powerbi is sorting the 'sales stage' alphabetically which isn't what we'd like. I tried creating an individual measure for each sales stage, but when you have multiple charts this is very long and also only seemed to help for stacked and pie charts, not for standard bar charts.
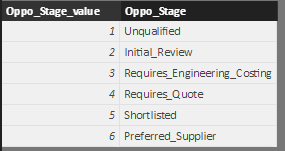
I do have a linked table which contains the sales stage and its order number:
However I can't get powerbi to sort in this order.
Please can you help?
Thanks in advance!
Solved! Go to Solution.
To use a different column when sorting, ensure that [Oppo_Stage] used in your visuals is from the table with the [Oppo_Stage_value] in it. In the Fields pane, select [Oppo_Stage], then in the Modeling tab, select Sort by Column, and choose [Oppo_Stage_value]. This should allow the text to be sorted based on the numbers.
Sort by Column
To use a different column when sorting, ensure that [Oppo_Stage] used in your visuals is from the table with the [Oppo_Stage_value] in it. In the Fields pane, select [Oppo_Stage], then in the Modeling tab, select Sort by Column, and choose [Oppo_Stage_value]. This should allow the text to be sorted based on the numbers.
Sort by Column
As simple as that! Thank you very much!
Join us in Barcelona for FabCon and SQLCon, the Fabric, Power BI, SQL, and AI community event. Save €200 with code FABCMTY200.
| User | Count |
|---|---|
| 24 | |
| 22 | |
| 20 | |
| 18 | |
| 14 |
| User | Count |
|---|---|
| 29 | |
| 22 | |
| 22 | |
| 20 | |
| 20 |