This is best Fabric, Power BI, SQL and AI community event. How do we know? The last event sold out! Save €200 with code FABCMTY200.
Register nowA new Data Days event is coming soon! This time we’re going bigger than ever. Fabric, Power BI, SQL, AI and more. Don't miss out.
Hi,
I am new to PBI and seek some guidance.
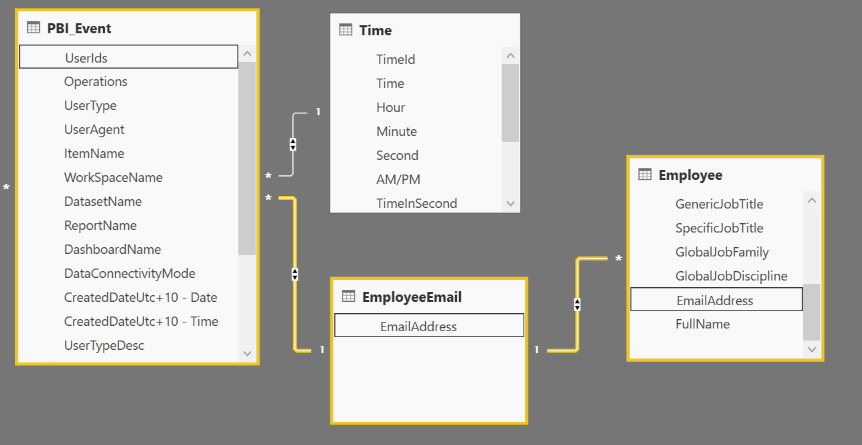
Please refer to the data model below.
Note that I had to create a bridge table called EmployeeEmail to join PBI_Event and Employee because otherwise it's Many to Many relationship.
I would like to analyze number of days from today each user/employee was last active.
For this, I created two measures:
LastActivity = CALCULATE(MAX(PBI_Event[CreatedDateUtc+10 - Date]))
InactivePeriodDays = VALUE(CALCULATE(TODAY() - [LastActivity]))
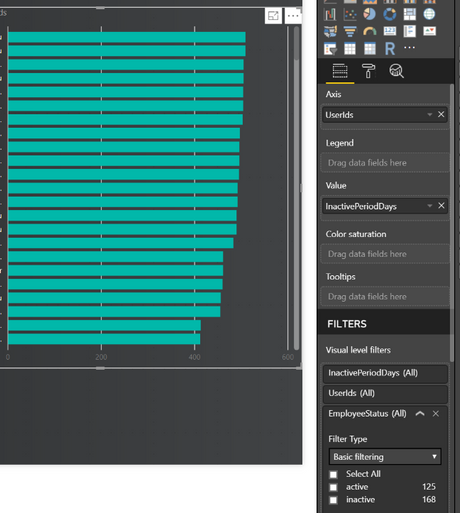
Then, using this measure in stacked bar char as per below.
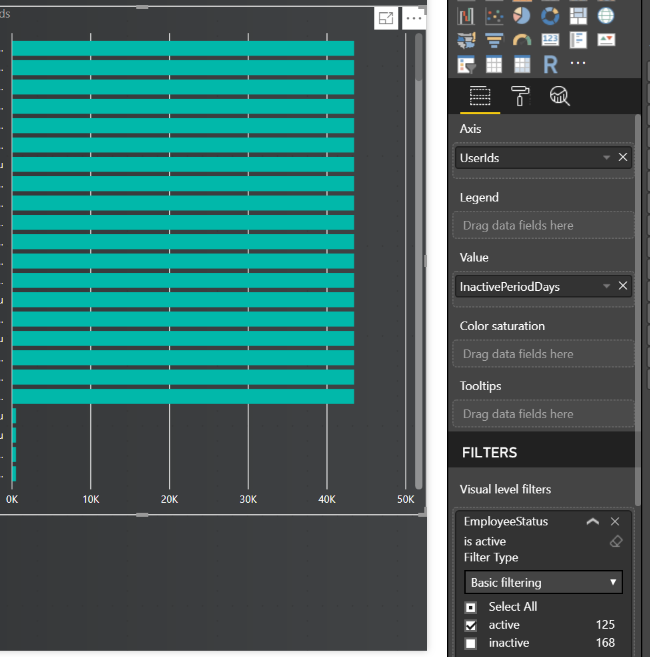
It seems to be working OK, but when I tried to filter the chart to only include active employee using [Employee].[EmployeeStatus] in the Visual Level Filter, the chart generates wrong data (see below).
Similarly, if I put EmailAddress in Visual level filter, and just choose an email address, it does not filter the chart to only show that user, so looks like the filtering does not work properly.
I am not sure why this occurs. Is it in the measure calculations and/or the data model relationship or something else that I miss?
Any advice is appreaciated.
Solved! Go to Solution.
@Anonymous,
Drag measure [LastActivity] to visual level filter and set Show items when the value is not blank.
@Anonymous,
Drag measure [LastActivity] to visual level filter and set Show items when the value is not blank.
Check out the May 2026 Power BI update to learn about new features.
Sign up to receive a private message when registration opens and key events begin.
If you have recently started exploring Fabric, we'd love to hear how it's going. Your feedback can help with product improvements.
| User | Count |
|---|---|
| 32 | |
| 25 | |
| 23 | |
| 22 | |
| 13 |
| User | Count |
|---|---|
| 61 | |
| 47 | |
| 27 | |
| 24 | |
| 19 |