

Get certified for free when you join Fabric Data Days 2026 and dive into Fabric, Power BI, SQL, AI, and other essential data skills.
Join nowJuly 7 - July 17 | Round 2 of the Power BI Dataviz World Championships. Don't miss your chance! Learn more
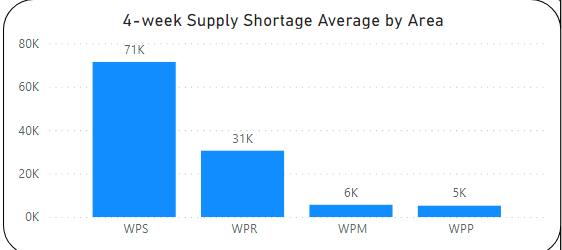
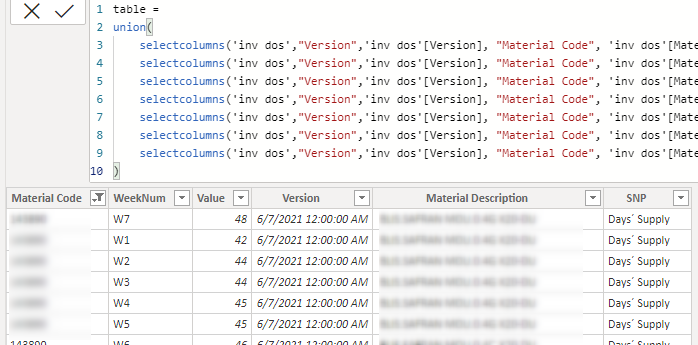
Hi! Below i have a graph, made of measure below which shows 4-w Average. (Material code has relationship with area in another table to be clear). Structure of table is also shown below. Weeks are like from 1 to 78 (W1 - W78). What i would like to accomplish is to make slicer(with slider/zip) that shows range from W1 to last Week and once you pick certain range like W2-W8 it shows average of W2-W8.
Does anyone have any idea how to do it? Is it even possible to do :)?
Thanks in advance!
Solved! Go to Solution.
@hejszyszki
You need to create another column in this table to extract the week number.
WeekNumber = INT(SUBSTITUTE(Table12[WeekNum],"W",""))
Then, you can use below measure and make sure you have slicer on the WeekNumber to select the range:
measure =
VAR __minweekno =
MIN ( 'invo dos'[WeekNumber] )
VAR __maxnweekno =
MAX ( 'invo dos'[WeekNumber] )
RETURN
SUMX (
FILTER (
'invo dos',
'invo dos'[SNP Plan] = "Short Supply"
&& 'invo dos'[WeekNumber] >= __minweekno
&& 'invo dos'[WeekNumber] <= __maxnweeknow
),
'invo dos'[Value]
)
Note: If your data expands into more than one year then you will have to add (Year + weekNumber )
⭕ Subscribe and learn Power BI from these videos
⚪ Website ⚪ LinkedIn ⚪ PBI User Group
@hejszyszki
The best approach to your problem is to unpivot your Weeks into two columns as follows
Material Code, Desc, SNP Plan, Week, Value
Refer to these videos on UnPivot: https://www.youtube.com/watch?v=Vff2kRBM95o&t=0s
⭕ Subscribe and learn Power BI from these videos
⚪ Website ⚪ LinkedIn ⚪ PBI User Group
Ended up with something like this. Stuck when trying to create slicer of average of picked range.
Thanks in advance!
@hejszyszki
You need to create another column in this table to extract the week number.
WeekNumber = INT(SUBSTITUTE(Table12[WeekNum],"W",""))
Then, you can use below measure and make sure you have slicer on the WeekNumber to select the range:
measure =
VAR __minweekno =
MIN ( 'invo dos'[WeekNumber] )
VAR __maxnweekno =
MAX ( 'invo dos'[WeekNumber] )
RETURN
SUMX (
FILTER (
'invo dos',
'invo dos'[SNP Plan] = "Short Supply"
&& 'invo dos'[WeekNumber] >= __minweekno
&& 'invo dos'[WeekNumber] <= __maxnweeknow
),
'invo dos'[Value]
)
Note: If your data expands into more than one year then you will have to add (Year + weekNumber )
⭕ Subscribe and learn Power BI from these videos
⚪ Website ⚪ LinkedIn ⚪ PBI User Group
Join us in Barcelona for FabCon and SQLCon, the Fabric, Power BI, SQL, and AI community event. Save €200 with code FABCMTY200.
Join Fabric Data Days 2026: 60 days of free live/on-demand sessions, challenges, study groups, and certification opportunities.
| User | Count |
|---|---|
| 24 | |
| 24 | |
| 17 | |
| 14 | |
| 13 |
| User | Count |
|---|---|
| 63 | |
| 41 | |
| 39 | |
| 39 | |
| 39 |