This is best Fabric, Power BI, SQL and AI community event. How do we know? The last event sold out! Save €200 with code FABCMTY200.
Register nowJuly 28 - August 9 | Final Round of the Power BI Dataviz World Championships. This is your chance. Learn more
Hello,
Can anyone guide on how to calculate category wise % contribution using total.
Ex - I have age group, no of voters and on selection from slicer of particular age group % of voters in selected age category should get displayed.
| Age Group | No of Voters |
| 21-30 | 100000 |
| 31-40 | 345000 |
| 41-50 | 545000 |
| 51-65 | 7500000 |
| 66-80 | 200000 |
Solved! Go to Solution.
@NidhiBhusari , based on what I got so far , a measure like
divide(sum(Table[No of Voters]), calculate(sum(Table[No of Voters]), allselected(Table)))
Hi, @NidhiBhusari
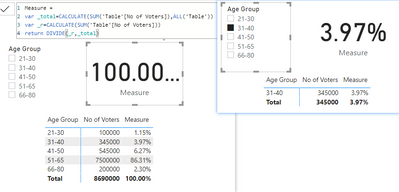
Try to create a measure like this:
Measure =
var _total=CALCULATE(SUM('Table'[No of Voters]),ALL('Table'))
var _r=CALCULATE(SUM('Table'[No of Voters]))
return DIVIDE(_r,_total)
Result:
Please refer to the attachment below for details
Hope this helps.
Best Regards,
Community Support Team _ Zeon Zheng
If this post helps, then please consider Accept it as the solution to help the other members find it more quickly.
Hi, @NidhiBhusari
Try to create a measure like this:
Measure =
var _total=CALCULATE(SUM('Table'[No of Voters]),ALL('Table'))
var _r=CALCULATE(SUM('Table'[No of Voters]))
return DIVIDE(_r,_total)
Result:
Please refer to the attachment below for details
Hope this helps.
Best Regards,
Community Support Team _ Zeon Zheng
If this post helps, then please consider Accept it as the solution to help the other members find it more quickly.
@NidhiBhusari , based on what I got so far , a measure like
divide(sum(Table[No of Voters]), calculate(sum(Table[No of Voters]), allselected(Table)))
Join us in Barcelona for FabCon and SQLCon, the Fabric, Power BI, SQL, and AI community event. Save €200 with code FABCMTY200.
If you love stickers, then you will definitely want to check out our community sticker challenge, Barcelona edition!
Check out the July 2026 Power BI update to learn about new features.
| User | Count |
|---|---|
| 25 | |
| 23 | |
| 19 | |
| 17 | |
| 14 |
| User | Count |
|---|---|
| 25 | |
| 23 | |
| 20 | |
| 20 | |
| 19 |