Join us at FabCon Vienna from September 15-18, 2025
The ultimate Fabric, Power BI, SQL, and AI community-led learning event. Save €200 with code FABCOMM.
Get registered- Power BI forums
- Get Help with Power BI
- Desktop
- Service
- Report Server
- Power Query
- Mobile Apps
- Developer
- DAX Commands and Tips
- Custom Visuals Development Discussion
- Health and Life Sciences
- Power BI Spanish forums
- Translated Spanish Desktop
- Training and Consulting
- Instructor Led Training
- Dashboard in a Day for Women, by Women
- Galleries
- Data Stories Gallery
- Themes Gallery
- Contests Gallery
- Quick Measures Gallery
- Notebook Gallery
- Translytical Task Flow Gallery
- TMDL Gallery
- R Script Showcase
- Webinars and Video Gallery
- Ideas
- Custom Visuals Ideas (read-only)
- Issues
- Issues
- Events
- Upcoming Events
Enhance your career with this limited time 50% discount on Fabric and Power BI exams. Ends August 31st. Request your voucher.
- Power BI forums
- Forums
- Get Help with Power BI
- Desktop
- Re: Calculate dynamic MIN/MAX of SUM
- Subscribe to RSS Feed
- Mark Topic as New
- Mark Topic as Read
- Float this Topic for Current User
- Bookmark
- Subscribe
- Printer Friendly Page
- Mark as New
- Bookmark
- Subscribe
- Mute
- Subscribe to RSS Feed
- Permalink
- Report Inappropriate Content
Calculate dynamic MIN/MAX of SUM
I have a simple dataset like below:
| type | month | year | value |
| A | Jan | 2017 | 20 |
| A | Feb | 2017 | 2 |
| A | Mar | 2017 | 14 |
| A | Jan | 2018 | 9 |
| A | Feb | 2018 | 30 |
| A | Mar | 2018 | 3 |
| A | Jan | 2019 | 17 |
| A | Feb | 2019 | 15 |
| A | Mar | 2019 | 30 |
| B | Jan | 2017 | 9 |
| B | Feb | 2017 | 9 |
| B | Mar | 2017 | 19 |
| B | Jan | 2018 | 24 |
| B | Feb | 2018 | 17 |
| B | Mar | 2018 | 17 |
| B | Jan | 2019 | 20 |
| B | Feb | 2019 | 9 |
| B | Mar | 2019 | 19 |
| C | Jan | 2017 | 26 |
| C | Feb | 2017 | 24 |
| C | Mar | 2017 | 28 |
| C | Jan | 2018 | 29 |
| C | Feb | 2018 | 10 |
| C | Mar | 2018 | 18 |
| C | Jan | 2019 | 29 |
| C | Feb | 2019 | 16 |
| C | Mar | 2019 | 14 |
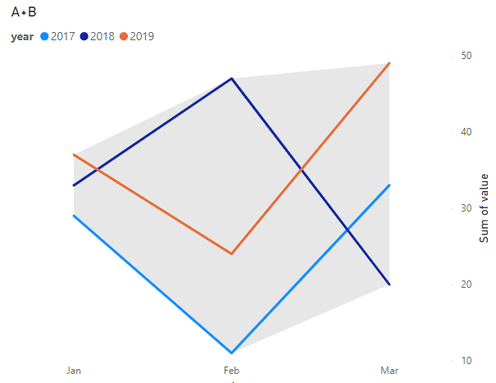
Goal is to create two MIN/MAX measures that capture the MIN/MAX of sum of any combination (determined by slicer) of the types (A, B and C) for each month across the years so that i can create a seasonal chart like below (sum of A & B), with the MIN/MAX measures set as Upper bound & Lower bound in Error Bars:
Thanks very much in advance!
- Mark as New
- Bookmark
- Subscribe
- Mute
- Subscribe to RSS Feed
- Permalink
- Report Inappropriate Content
New question arises.... how do I hide e.g. 2017 from legends and yet still display the same MIN/MAX like the below?
- Mark as New
- Bookmark
- Subscribe
- Mute
- Subscribe to RSS Feed
- Permalink
- Report Inappropriate Content
sum_value = CALCULATE ( SUM( table[value] ), ALLSELECTED( table[type] ) )
max_of_sum = MAXX( ALLSELECTED( table[type], table[year] ), table[sum_value] )
min_of_sum = MINX( ALLSELECTED( table[type], table[year] ), table[sum_value] )Have played around a bit, the above seems to work - would love some confirmation here?
Thanks vm
Helpful resources
| User | Count |
|---|---|
| 75 | |
| 70 | |
| 40 | |
| 30 | |
| 28 |
| User | Count |
|---|---|
| 104 | |
| 95 | |
| 51 | |
| 50 | |
| 46 |


