cancel
Showing results for 
Search instead for 
Did you mean: 

The Fabric community is upgrading! Read all of the details including the timeline and what you can expect. Learn more

Reply
Nyx
Frequent Visitor

Calculate different rows from separate columns

Hi,

I need a measure than can take a column and add or minus another column.

The columns will always have the same number of rows but will be from different dated rows.


I have this:

Jan-221 
Feb-222 
Mar-223 
Apr-224 
May-225 
Jun-226 
Jul-22 7
Aug-22 8
Sep-22 9
Oct-22 10
Nov-22 11
Dec-22 12


I want to do:

1-7=-6

2-8=-6

etc.

1 ACCEPTED SOLUTION
Anonymous
Not applicable

Hi  @Nyx ,


Here are the steps you can follow:

1. Create calculated table.

Date =
CALENDAR(
    DATE(
        2022,1,1),
    DATE(
        2022,12,31))
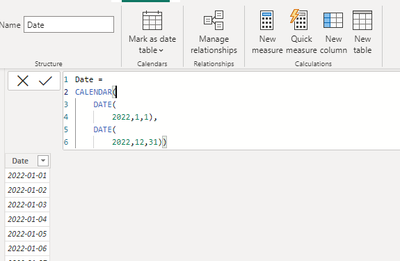
vyangliumsft_0-1675316995877.png

2. Create calculated column.

Column =

var _table1=
SUMMARIZE(
    'Table1',
    'Table1'[Date],
    "Index1"
    MAXX(FILTER(ALL('Date'),
FORMAT(
   'Date'[Date],"mmm")=LEFT('Table1'[Date],3)),MONTH('Date'[Date])))
var _table2=
ADDCOLUMNS(
    _table1,"Index2",IF([Index1]<=6,
    MAXX(FILTER(_table1,[Index1]=EARLIER([Index1])+6),[Index1]),
     MAXX(FILTER(_table1,[Index1]=EARLIER([Index1])-6),[Index1])    
    ))
return
MINX(FILTER(_table2,[Date]=EARLIER(Table1[Date])),[Index1])
-
MINX(FILTER(_table2,[Date]=EARLIER(Table1[Date])),[Index2])

3. Result:

vyangliumsft_1-1675316995879.png


Best Regards,

Liu Yang

If this post helps, then please consider Accept it as the solution to help the other members find it more quickly

View solution in original post

2 REPLIES 2
Anonymous
Not applicable

Hi  @Nyx ,


Here are the steps you can follow:

1. Create calculated table.

Date =
CALENDAR(
    DATE(
        2022,1,1),
    DATE(
        2022,12,31))

vyangliumsft_0-1675316995877.png

2. Create calculated column.

Column =

var _table1=
SUMMARIZE(
    'Table1',
    'Table1'[Date],
    "Index1"
    MAXX(FILTER(ALL('Date'),
FORMAT(
   'Date'[Date],"mmm")=LEFT('Table1'[Date],3)),MONTH('Date'[Date])))
var _table2=
ADDCOLUMNS(
    _table1,"Index2",IF([Index1]<=6,
    MAXX(FILTER(_table1,[Index1]=EARLIER([Index1])+6),[Index1]),
     MAXX(FILTER(_table1,[Index1]=EARLIER([Index1])-6),[Index1])    
    ))
return
MINX(FILTER(_table2,[Date]=EARLIER(Table1[Date])),[Index1])
-
MINX(FILTER(_table2,[Date]=EARLIER(Table1[Date])),[Index2])

3. Result:

vyangliumsft_1-1675316995879.png


Best Regards,

Liu Yang

If this post helps, then please consider Accept it as the solution to help the other members find it more quickly

Nyx
Frequent Visitor

I cna split these into two table expressions easily, but cannot find a way to index them so that the first

populated row of column 2 gets subtracted by the first populated row of column 1. It wants to use the Date column as the index or filter to line up the equation.

Helpful resources

Announcements
FabCon and SQLCon Barcelona 2026

FabCon & SQLCon – Barcelona 2026

Join us in Barcelona for FabCon and SQLCon, the Fabric, Power BI, SQL, and AI community event. Save €200 with code FABCMTY200.

Power BI DataViz World Championships carousel

Power BI DataViz World Championships - June 2026

A new Power BI DataViz World Championship is coming this June! Don't miss out on submitting your entry.