Get certified for free when you join Fabric Data Days 2026 and dive into Fabric, Power BI, SQL, AI, and other essential data skills.
Join nowJuly 28 - August 9 | Final Round of the Power BI Dataviz World Championships. This is your chance. Learn more
Hello,
I would appreciate any general guidance/info on this topic.
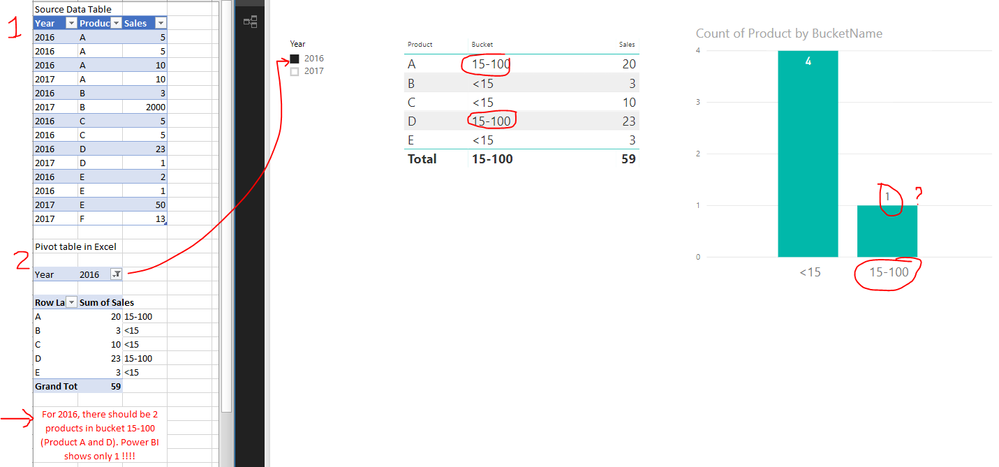
I have a simple sales table and I am trying to group (bin) all products into categories of <15, 15-100 and >100.
To categorise each product into a bucket, I created a measure. Bucket = if(sum(Table1[Sales])<15,"<15",if(sum(Table1[Sales])>100,"more than 100","15-100"))
To be able to use this measure on a map, I put it in a calculated column.
BucketName = CALCULATE([Bucket])
However, when I filter by year, the bucket (measure) doesn't change as it should. Does anyone know how PowerBI works in this situation?
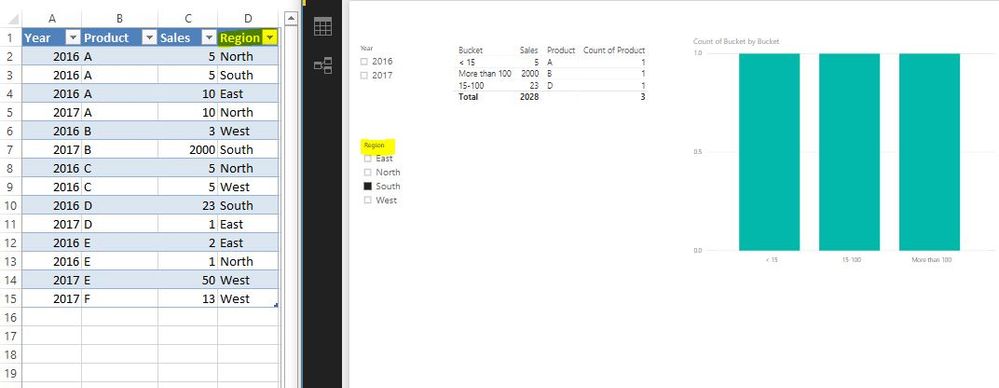
Here is all the data and PowerBI charts:
Solved! Go to Solution.
For reference :
This issue was solved in another post. https://community.powerbi.com/t5/Desktop/Dynamic-Segmentation-with-duplicate-rows/m-p/379859
HI @misul
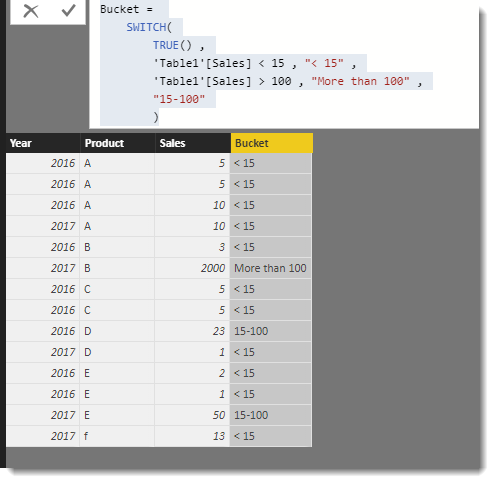
Why not add a calculated column to your table like this
Bucket =
SWITCH(
TRUE() ,
'Table1'[Sales] < 15 , "< 15" ,
'Table1'[Sales] > 100 , "More than 100" ,
"15-100"
)
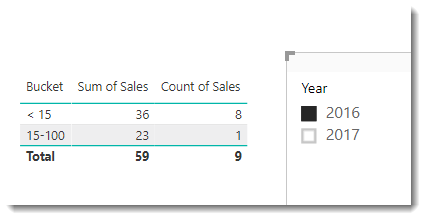
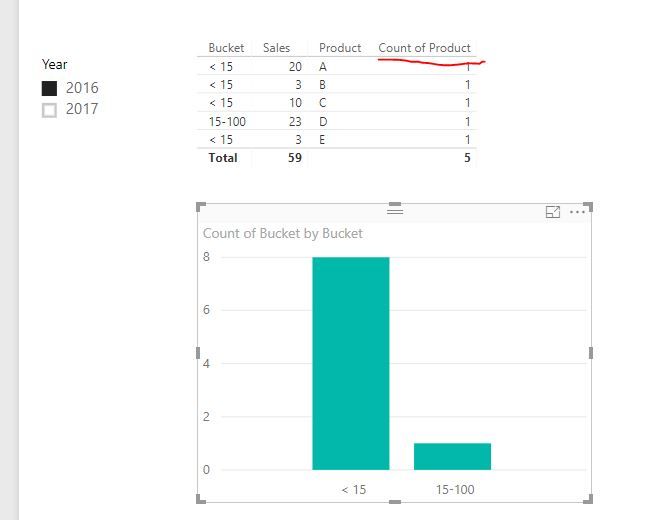
thanks for your comment. However, I am looking for count of Product, not count of Sales. In other words, trying to answer the question "Which are the products that had total sales of <15 in this year?" For 2016, the answer should be 3 products.
I applied your Switch formula ,but it doesn't solve this.
Some further info:
The final goal is apply the same buckets on a global as well as regional level. This means, in my understanding, that the bucket applied to each row should be applied AFTER the filters are year/region are implented.
That's why I tried to use a measure rather than a calculated column. Or perhpas a combination of the two (which I haven't figured out yet).
For reference :
This issue was solved in another post. https://community.powerbi.com/t5/Desktop/Dynamic-Segmentation-with-duplicate-rows/m-p/379859
If you love stickers, then you will definitely want to check out our community sticker challenge, Barcelona edition!
Check out the July 2026 Power BI update to learn about new features.
| User | Count |
|---|---|
| 28 | |
| 28 | |
| 19 | |
| 19 | |
| 19 |
| User | Count |
|---|---|
| 37 | |
| 29 | |
| 18 | |
| 17 | |
| 15 |