This is best Fabric, Power BI, SQL and AI community event. How do we know? The last event sold out! Save €200 with code FABCMTY200.
Register nowJuly 28 - August 9 | Final Round of the Power BI Dataviz World Championships. This is your chance. Learn more
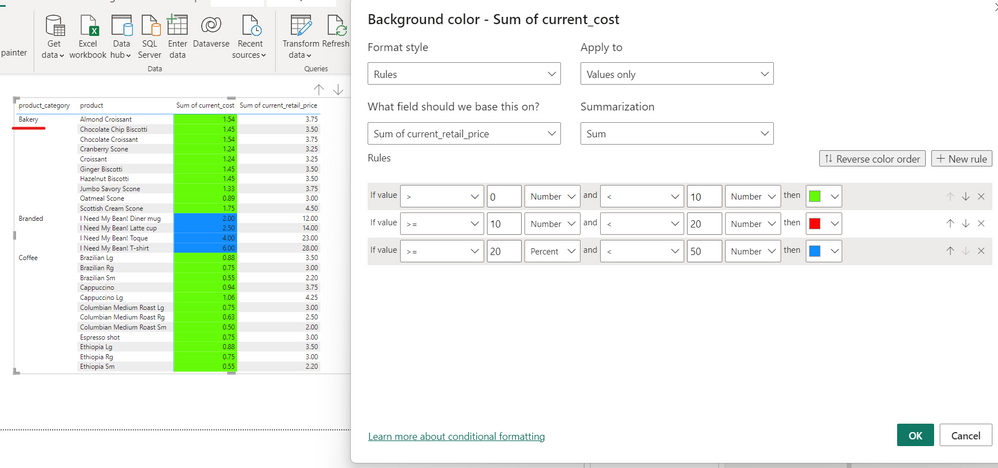
I would like to give different conditional formatting for product bakery
while others should remain the same
Solved! Go to Solution.
Hi @Evanooruvan ,
For this you need to create a metric that refers explicity to the bakery products something similar to:
Formatting =
SWITCH (
TRUE (),
SELECTEDVALUE ( Table[product_category] ) = "Bakery"
&& SUM ( Table[current_retail_price] ) < 10, "green",
SELECTEDVALUE ( Table[product_category] ) = "Bakery"
&& SUM ( Table[current_retail_price] ) < 20, "red",
SELECTEDVALUE ( Table[product_category] ) = "Bakery"
&& SUM ( Table[current_retail_price] ) < 50, "blue"
)
Regards
Miguel Félix
Proud to be a Super User!
Check out my blog: Power BI em PortuguêsHi @Evanooruvan ,
For this you need to create a metric that refers explicity to the bakery products something similar to:
Formatting =
SWITCH (
TRUE (),
SELECTEDVALUE ( Table[product_category] ) = "Bakery"
&& SUM ( Table[current_retail_price] ) < 10, "green",
SELECTEDVALUE ( Table[product_category] ) = "Bakery"
&& SUM ( Table[current_retail_price] ) < 20, "red",
SELECTEDVALUE ( Table[product_category] ) = "Bakery"
&& SUM ( Table[current_retail_price] ) < 50, "blue"
)
Regards
Miguel Félix
Proud to be a Super User!
Check out my blog: Power BI em PortuguêsJoin us in Barcelona for FabCon and SQLCon, the Fabric, Power BI, SQL, and AI community event. Save €200 with code FABCMTY200.
If you love stickers, then you will definitely want to check out our community sticker challenge, Barcelona edition!
Check out the July 2026 Power BI update to learn about new features.
| User | Count |
|---|---|
| 25 | |
| 23 | |
| 19 | |
| 17 | |
| 14 |
| User | Count |
|---|---|
| 25 | |
| 24 | |
| 20 | |
| 19 | |
| 19 |