This is best Fabric, Power BI, SQL and AI community event. How do we know? The last event sold out! Save €200 with code FABCMTY200.
Register nowThe Fabric community is now in read-only for platform upgrade. Learn more
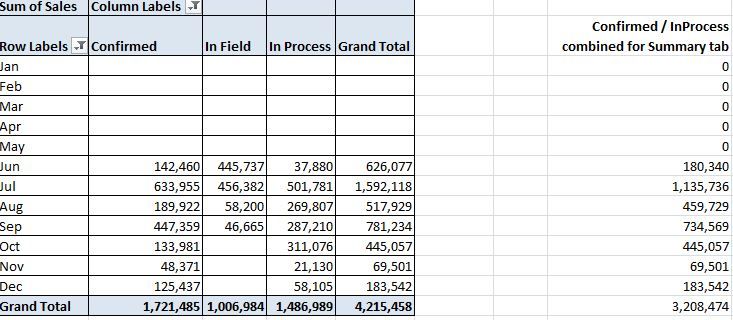
Original
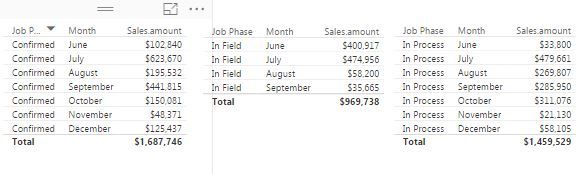
Current (had to break it down into separate tables)
I am very new to powerbi, but how do you create multiple columns with the summations based on that status based on different statuses of the original data colum?
Solved! Go to Solution.
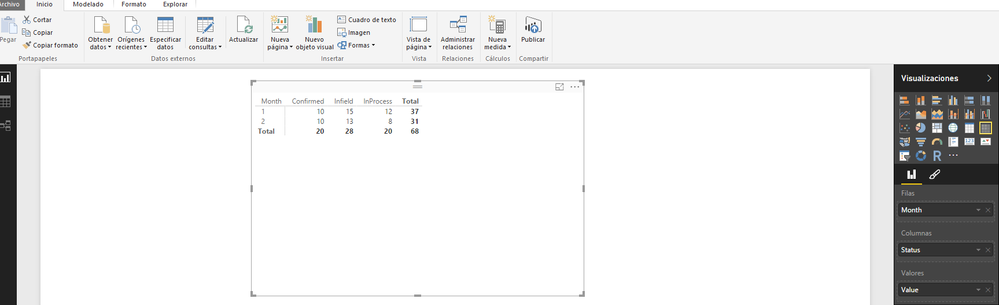
You could try with a matrix visualization.
Put Month on Rows, Job Phase on Columns and Sales Amount in value.
Thank you both for your quick assistance!
Ok
Join us in Barcelona for FabCon and SQLCon, the Fabric, Power BI, SQL, and AI community event. Save €200 with code FABCMTY200.
| User | Count |
|---|---|
| 23 | |
| 22 | |
| 14 | |
| 14 | |
| 13 |
| User | Count |
|---|---|
| 47 | |
| 39 | |
| 24 | |
| 20 | |
| 20 |