This time we’re going bigger than ever. Fabric, Power BI, SQL, AI and more. We're covering it all. You won't want to miss it.
Learn moreLevel up your Power BI skills this month - build one visual each week and tell better stories with data! Get started
Hello,
I'm not sure why I am not getting this so I could please use some help. I have the following dataset:
| Task Name | Planned Count | Planned Finish | Commit Count | Commit Finish | Actual Count | Actual Finish |
| task 1 | 1 | 1/29/2021 | 0 | 1 | 1/29/2021 | |
| task2 | 1 | 8/28/2020 | 0 | 1 | 8/28/2020 | |
| task3 | 1 | 2/16/2021 | 0 | 1 | 2/16/2021 | |
| task4 | 1 | 9/11/2020 | 0 | 1 | 9/11/2020 | |
| task5 | 1 | 8/27/2021 | 1 | 10/1/2021 | 0 | |
| task6 | 1 | 4/30/2021 | 0 | 1 | 4/30/2021 | |
| task7 | 1 | 1/29/2021 | 0 | 1 | 1/29/2021 | |
| task8 | 1 | 7/30/2021 | 1 | 8/20/2021 | 0 | |
| task9 | 1 | 6/7/2021 | 0 | 1 | 6/7/2021 | |
| task10 | 1 | 7/19/2021 | 1 | 7/19/2021 | 0 | |
| task11 | 1 | 7/16/2021 | 1 | 8/6/2021 | 0 | |
| task12 | 1 | 7/23/2021 | 1 | 8/5/2021 | 0 | |
| task13 | 1 | 9/11/2020 | 0 | 1 | 9/11/2020 |
I need to be able to graph the following measures:
Any assistance would be appreciated!
Thank you!!
@amitchandak While I admire your correct syntax your spelling of count might have missed something. ;-O
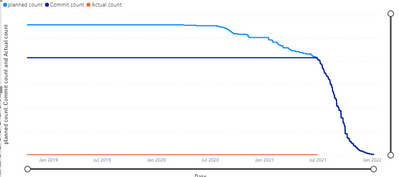
Unfortunately this produces lines that start with the first date in the date table instead of the first date where there is data and it also produces flat lines for actual.
After thinking about this a little more I realize my requirements change a little.
The lines should be based on the original data:
Planned: starts at 8/28/2020 and steps down from 13 to 0
Actual: starts at 8/28/20 and starts at 13 and counts down 8
Commit: starts at 7/19/21 and starts at 5 and counts down to zero.
Actual + Commit = Planned
Start dates are always the first date where there is a count.
Existing graph:
@jschaefer , I think you need
Reverse cumulative
Join all three dates with date table
then create measures like
planned = sum(Table[Planned Count])
Commit = calculate(sum(Table[Commit Count]), userelationship('Date'[date], Table[Commit Finish]), not(isblank(Table[Commit Finish])))
Actual = calculate(sum(Table[Commit Count]), userelationship('Date'[date], Table[Actual Finish]), not(isblank(Table[Actual Finish])))
planned **bleep** = calculate([planned], filter(allselected('Date'),'Date'[date] >=max('Date'[date])))
Commit **bleep** = calculate([Commit], filter(allselected('Date'),'Date'[date] >=max('Date'[date])))
Actual **bleep** = calculate([Actual], filter(allselected('Date'),'Date'[date] >=max('Date'[date])))
To get the best of the time intelligence function. Make sure you have a date calendar and it has been marked as the date in model view. Also, join it with the date column of your fact/s. Refer :radacad sqlbi My Video Series Appreciate your Kudos.
refer to my blog on similar topic if needed
Check out the April 2026 Power BI update to learn about new features.
Sign up to receive a private message when registration opens and key events begin.
If you have recently started exploring Fabric, we'd love to hear how it's going. Your feedback can help with product improvements.
| User | Count |
|---|---|
| 4 | |
| 4 | |
| 3 | |
| 3 | |
| 3 |
| User | Count |
|---|---|
| 9 | |
| 8 | |
| 8 | |
| 6 | |
| 6 |