FabCon is coming to Atlanta
Join us at FabCon Atlanta from March 16 - 20, 2026, for the ultimate Fabric, Power BI, AI and SQL community-led event. Save $200 with code FABCOMM.
Register now!- Power BI forums
- Get Help with Power BI
- Desktop
- Service
- Report Server
- Power Query
- Mobile Apps
- Developer
- DAX Commands and Tips
- Custom Visuals Development Discussion
- Health and Life Sciences
- Power BI Spanish forums
- Translated Spanish Desktop
- Training and Consulting
- Instructor Led Training
- Dashboard in a Day for Women, by Women
- Galleries
- Data Stories Gallery
- Themes Gallery
- Contests Gallery
- QuickViz Gallery
- Quick Measures Gallery
- Visual Calculations Gallery
- Notebook Gallery
- Translytical Task Flow Gallery
- TMDL Gallery
- R Script Showcase
- Webinars and Video Gallery
- Ideas
- Custom Visuals Ideas (read-only)
- Issues
- Issues
- Events
- Upcoming Events
The Power BI Data Visualization World Championships is back! Get ahead of the game and start preparing now! Learn more
- Power BI forums
- Forums
- Get Help with Power BI
- DAX Commands and Tips
- Re: How to sum when filter is based on the row
- Subscribe to RSS Feed
- Mark Topic as New
- Mark Topic as Read
- Float this Topic for Current User
- Bookmark
- Subscribe
- Printer Friendly Page
- Mark as New
- Bookmark
- Subscribe
- Mute
- Subscribe to RSS Feed
- Permalink
- Report Inappropriate Content
How to sum when filter is based on the row
Hi All,
I have a fact table that contain:
- amount of sales (DC)
- Department (product group)
- department&year&month (product group & FYM)
I want to create a formule similer to excel sum if that doing for each row:
=DC/ sumof DC according to the productroup&FYM
for eample, I want to get in the first row = 7286/(7286+4372+5829+7286)
for the seconf row = 4372/(7286+4372+5829+7286)
for the last row = 8473/(7286+4372+8743)
Thx !
- Mark as New
- Bookmark
- Subscribe
- Mute
- Subscribe to RSS Feed
- Permalink
- Report Inappropriate Content
Would you be able to upload the PBIX to Google Drive, and then share the link here in this thread?
Regards,
Nathan
- Mark as New
- Bookmark
- Subscribe
- Mute
- Subscribe to RSS Feed
- Permalink
- Report Inappropriate Content
As mentioned previously....
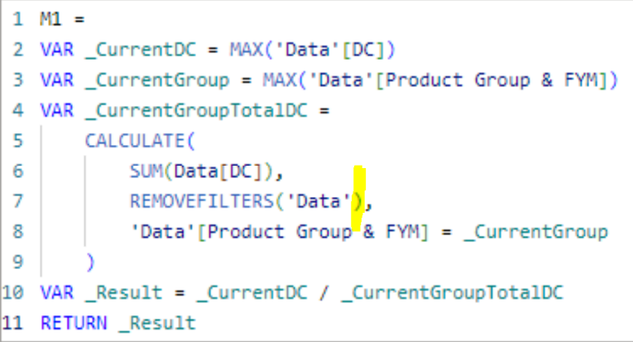
1) You (still) need to close the REMOVEFILTERS argument with a ")" after your 'Invoices' table.
INCORRECT: REMOVEFILTERS(Invoices, Invoices[Productgroup...))
CORRECT: REMOVEFILTERS(Invoices), Invoices[Productgroup...)
2) You've also placed 2 close parenthesis back to back at the end of the CALCULATE. You only need 1.
Your code....
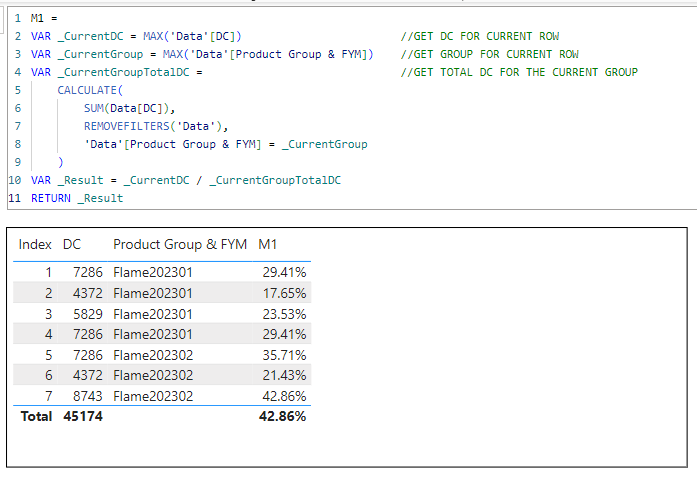
My code...
NOTE: When you use functions with multiple parameters, it is easier to read & avoid syntax errors if you separate each parameter onto its own line. Notice how in your code, you have the entire CALCULATE (with all 3 parameters) on one single code line. This can make it more difficult to see where parenthesis need to match up, as well as the separation of params. Notice how in my code, it's much easier to see these things, simply because the params are each separated onto their own lines.
Regards,
Nathan
P.S. If this does not resolve it for you, you can upload the PBIX to Google Drive, and then share the link here in this thread.
- Mark as New
- Bookmark
- Subscribe
- Mute
- Subscribe to RSS Feed
- Permalink
- Report Inappropriate Content
So the formula is finally worked but something is odd with the numbers, its suppose its need to sum into 100% every customergroup & FYM, but as seen below, its not, did I did something wrong ? it got uo tp 85%
- Mark as New
- Bookmark
- Subscribe
- Mute
- Subscribe to RSS Feed
- Permalink
- Report Inappropriate Content
If it's still not working, please share the link to the PBIX and I should hopefully be able to get it working for you.
If that is not possible, then send me your code again, with results (or errors) as before.
Regards,
Nathan
- Mark as New
- Bookmark
- Subscribe
- Mute
- Subscribe to RSS Feed
- Permalink
- Report Inappropriate Content
Im ok sharing it with u just not sure how to 🙂
but we are getting closer,
any idea whats wrong at row 3?
- Mark as New
- Bookmark
- Subscribe
- Mute
- Subscribe to RSS Feed
- Permalink
- Report Inappropriate Content
OK, yeah. You don't want to create calculated columns in this case.
You just want to create 1 single measure, and add it to your table visual.
It's the same measure I shared originally.
The measure shows how to create VARs within a measure.
You simply use the keyword "VAR", followed by the variable name (any name you like), and then assign the variable whatever value or calculation.
Please create the measure shown (with your table/column references of course) and add it to the table visual.
Regards,
Nathan
- Mark as New
- Bookmark
- Subscribe
- Mute
- Subscribe to RSS Feed
- Permalink
- Report Inappropriate Content
Tried to create the first measure
I got the following error, what am I missing ??
- Mark as New
- Bookmark
- Subscribe
- Mute
- Subscribe to RSS Feed
- Permalink
- Report Inappropriate Content
1) You need to close the REMOVEFILTERS argument with a ")" after your 'Invoices' table.
INCORRECT: REMOVEFILTERS(Invoices, Invoices[Productgroup...))
CORRECT: REMOVEFILTERS(Invoices), Invoices[Productgroup...)
2) You need to check where Invoices[Productgroup& FYM] = _CurrentGroup (which is a VAR), rather than Invoices[VAR_group], which looks like a 'table'[column].
3) In the screenshot of your measure, it looks like you're just starting with the CALCULATE, rather than declaring the variables needed.
Please try to follow the same structure of the measure provided.
4 VARS, followed by a RETURN.
Regards,
Nathan
- Mark as New
- Bookmark
- Subscribe
- Mute
- Subscribe to RSS Feed
- Permalink
- Report Inappropriate Content
yes, I build the first 3 var that u meantioned as table (column),
not sure how to built VAR (im pretty new to this and im not working with SQL at all)
- Mark as New
- Bookmark
- Subscribe
- Mute
- Subscribe to RSS Feed
- Permalink
- Report Inappropriate Content
- Mark as New
- Bookmark
- Subscribe
- Mute
- Subscribe to RSS Feed
- Permalink
- Report Inappropriate Content
Hi, maybe im missing here something
at row 8 in your explanation
where:
productgroup&FYM is my original column
Var_group =
Helpful resources

Power BI Monthly Update - November 2025
Check out the November 2025 Power BI update to learn about new features.

Fabric Data Days
Advance your Data & AI career with 50 days of live learning, contests, hands-on challenges, study groups & certifications and more!

| User | Count |
|---|---|
| 20 | |
| 10 | |
| 9 | |
| 4 | |
| 4 |
| User | Count |
|---|---|
| 34 | |
| 31 | |
| 19 | |
| 12 | |
| 10 |


