Join us in Barcelona for FabCon and SQLCon, September 28 - October 1, 2026.
This is best Fabric, Power BI, SQL and AI community event. How do we know? The last event sold out! Save €200 with code FABCMTY200.
Register now- Power BI forums
- Get Help with Power BI
- Desktop
- Service
- Report Server
- Power Query
- Mobile Apps
- Developer
- DAX Commands and Tips
- Custom Visuals Development Discussion
- Health and Life Sciences
- Power BI Spanish forums
- Translated Spanish Desktop
- Training and Consulting
- Instructor Led Training
- Dashboard in a Day for Women, by Women
- Galleries
- Data Stories Gallery
- Themes Gallery
- Contests Gallery
- QuickViz Gallery
- Quick Measures Gallery
- Visual Calculations Gallery
- Fabric Apps Gallery
- Notebook Gallery
- Translytical Task Flow Gallery
- TMDL Gallery
- R Script Showcase
- Webinars and Video Gallery
- Ideas
- Custom Visuals Ideas (read-only)
- Issues
- Issues
- Events
- Upcoming Events
The Fabric community is upgrading! Read all of the details including the timeline and what you can expect. Learn more
- Power BI forums
- Forums
- Get Help with Power BI
- DAX Commands and Tips
- Re: DAX Measure Error In One Row In A Matrix
- Subscribe to RSS Feed
- Mark Topic as New
- Mark Topic as Read
- Float this Topic for Current User
- Bookmark
- Subscribe
- Printer Friendly Page


- Mark as New
- Bookmark
- Subscribe
- Mute
- Subscribe to RSS Feed
- Permalink
- Report Inappropriate Content
DAX Measure Error In One Row In A Matrix


- Mark as New
- Bookmark
- Subscribe
- Mute
- Subscribe to RSS Feed
- Permalink
- Report Inappropriate Content
- Mark as New
- Bookmark
- Subscribe
- Mute
- Subscribe to RSS Feed
- Permalink
- Report Inappropriate Content
- Mark as New
- Bookmark
- Subscribe
- Mute
- Subscribe to RSS Feed
- Permalink
- Report Inappropriate Content
Hi @Grizzlydad ,
Try Troubleshooting your measures
Create Measures
Measure 1 Region = CALCULATE ( SUM ( Tbl_NationalRawData[Minutes Taken To Respond]), Tbl_NationalRawData[Region Responded]= "REGION" )
Measure2 NILO = CALCULATE ( SUM ( Tbl_NationalRawData[Minutes Taken To Respond]), Tbl_NationalRawData[NILO Responded]= "NILO" )
Difference = Measure 1 Region - Measure2 NILO
See what values are returned by all these 3 measures separately.
Regards,
Harsh Nathani
Did I answer your question? Mark my post as a solution! Appreciate with a Kudos!! (Click the Thumbs Up Button)
- Mark as New
- Bookmark
- Subscribe
- Mute
- Subscribe to RSS Feed
- Permalink
- Report Inappropriate Content
- Mark as New
- Bookmark
- Subscribe
- Mute
- Subscribe to RSS Feed
- Permalink
- Report Inappropriate Content
Hi @Grizzlydad ,
Have you created these measures.
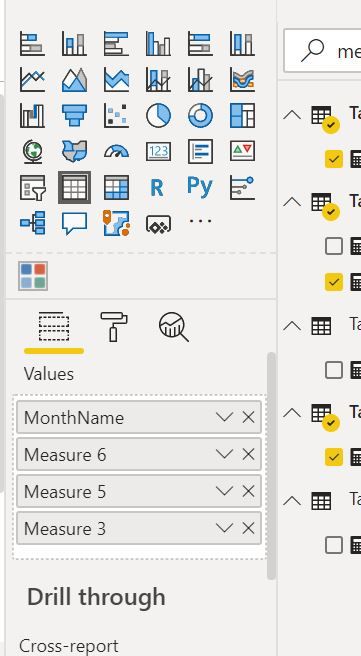
Not against the Month Column in the Visualization Pane, what is the value of thes measures.
Regards,
Harsh Nathani
Did I answer your question? Mark my post as a solution! Appreciate with a Kudos!! (Click the Thumbs Up Button)


- Mark as New
- Bookmark
- Subscribe
- Mute
- Subscribe to RSS Feed
- Permalink
- Report Inappropriate Content
Hi @Grizzlydad ,
Try modifying your DAX expression as follows:
NILO Saving (Minutes) = CALCULATE ( SUM ( Tbl_NationalRawData[Minutes Taken To Respond]), FILTER(ALLSELECTED(Tbl_NationalRaw), Tbl_NationalRawData[Region Responded]= "REGION" )) -
CALCULATE ( SUM ( Tbl_NationalRawData[Minutes Taken To Respond]), FILTER(ALLSELECTED(Tbl_NationalRaw), Tbl_NationalRawData[NILO Responded]= "NILO" ))
Thanks,
Pragati
- Mark as New
- Bookmark
- Subscribe
- Mute
- Subscribe to RSS Feed
- Permalink
- Report Inappropriate Content
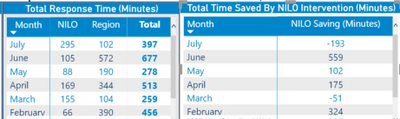
Hi thanks, that has made each month have the same total now which is the total minutes saved year to date, not individual month totals.

Helpful resources

FabCon & SQLCon – Barcelona 2026
Join us in Barcelona for FabCon and SQLCon, the Fabric, Power BI, SQL, and AI community event. Save €200 with code FABCMTY200.

Power BI DataViz World Championships - June 2026
A new Power BI DataViz World Championship is coming this June! Don't miss out on submitting your entry.

| User | Count |
|---|---|
| 2 | |
| 2 | |
| 2 | |
| 1 | |
| 1 |


