Become a Certified Power BI Data Analyst!
Join us for an expert-led overview of the tools and concepts you'll need to pass exam PL-300. The first session starts on June 11th. See you there!
Get registered- Power BI forums
- Get Help with Power BI
- Desktop
- Service
- Report Server
- Power Query
- Mobile Apps
- Developer
- DAX Commands and Tips
- Custom Visuals Development Discussion
- Health and Life Sciences
- Power BI Spanish forums
- Translated Spanish Desktop
- Training and Consulting
- Instructor Led Training
- Dashboard in a Day for Women, by Women
- Galleries
- Webinars and Video Gallery
- Data Stories Gallery
- Themes Gallery
- Contests Gallery
- Quick Measures Gallery
- Notebook Gallery
- Translytical Task Flow Gallery
- R Script Showcase
- Ideas
- Custom Visuals Ideas (read-only)
- Issues
- Issues
- Events
- Upcoming Events
Power BI is turning 10! Let’s celebrate together with dataviz contests, interactive sessions, and giveaways. Register now.
- Power BI forums
- Forums
- Get Help with Power BI
- DAX Commands and Tips
- Average basket size containing SKU's
- Subscribe to RSS Feed
- Mark Topic as New
- Mark Topic as Read
- Float this Topic for Current User
- Bookmark
- Subscribe
- Printer Friendly Page
- Mark as New
- Bookmark
- Subscribe
- Mute
- Subscribe to RSS Feed
- Permalink
- Report Inappropriate Content
Average basket size containing SKU's
I have a table with ordered SKU's. One line is a one position on one order. In one order client can buy many different SKU's. I'd like to calculate and analize average basket size (value) included next SKU's. Could you help me?
For example for SKU 01111 it will be (order 001) SUM=6; (order 003) SUM=16, so avg order is (16+6)/2=11
| Date | | No of order | | SKU | | Value |
| 2022-12-01 | | 001 | | 02222 | | 2 |
| 2022-12-01 | | 001 | | 01111 | | 4 |
| 2022-12-01 | | 002 | | 02222 | | 10 |
| 2022-12-01 | | 003 | | 02222 | | 3 |
| 2022-12-01 | | 003 | | 04444 | | 2 |
| 2022-12-01 | | 003 | | 06666 | | 9 |
| 2022-12-01 | | 003 | | 01111 | | 2 |
| 2022-12-02 | | 004 | | 02222 | | 4 |
| 2022-12-02 | | 005 | | 03333 | | 2 |
| 2022-12-02 | | 005 | | 04444 | | 7 |
| 2022-12-02 | | 005 | | 01111 | | 4 |
| 2022-12-02 | | 006 | | 05555 | | 7 |
| SKU | | Avg basket size with SKU |
| 011111 | | 11 |
| 022222 | | ? |
Solved! Go to Solution.
- Mark as New
- Bookmark
- Subscribe
- Mute
- Subscribe to RSS Feed
- Permalink
- Report Inappropriate Content
Hi @Rpxx ,
Here are the steps you can follow:
1. Create measure.
Avg basket size with SKU =
var _column=SELECTCOLUMNS(FILTER(ALL('Table'),'Table'[Date]=MAX('Table'[Date])&&'Table'[SKU]=MAX('Table'[SKU])),"1",[No of order])
var _count=
CALCULATE(DISTINCTCOUNT('Table'[No of order]),FILTER(ALL('Table'),
'Table'[SKU]=MAX('Table'[SKU])&&'Table'[Date]=MAX('Table'[Date])))
var _sum=
SUMX(FILTER(ALL('Table'),'Table'[No of order] in _column&&'Table'[Date]=MAX('Table'[Date])),[Value])
return
DIVIDE(_sum,_count)
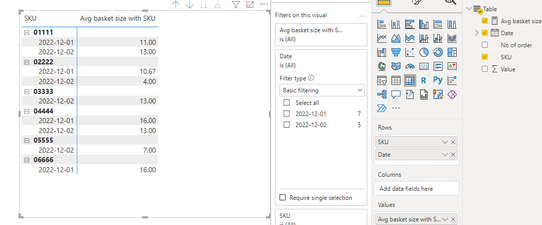
2. Result:
Best Regards,
Liu Yang
If this post helps, then please consider Accept it as the solution to help the other members find it more quickly
- Mark as New
- Bookmark
- Subscribe
- Mute
- Subscribe to RSS Feed
- Permalink
- Report Inappropriate Content
This is my expected result. Could you help me? Date is not important...
- Mark as New
- Bookmark
- Subscribe
- Mute
- Subscribe to RSS Feed
- Permalink
- Report Inappropriate Content
Could you describe what is the next steps to calculate these numbers in your file? I don't understand...
Helpful resources
| User | Count |
|---|---|
| 16 | |
| 14 | |
| 13 | |
| 12 | |
| 11 |
| User | Count |
|---|---|
| 19 | |
| 16 | |
| 15 | |
| 11 | |
| 9 |


