cancel
Showing results for 
Search instead for 
Did you mean: 

July 7 - July 17 | Round 2 of the Power BI Dataviz World Championships. Don't miss your chance! Learn more

Reply
Anonymous
Not applicable

Need help creating custom Visual

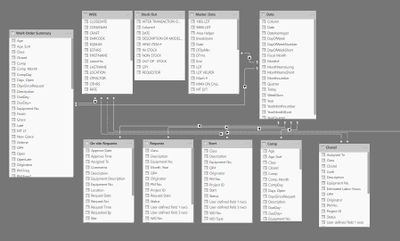
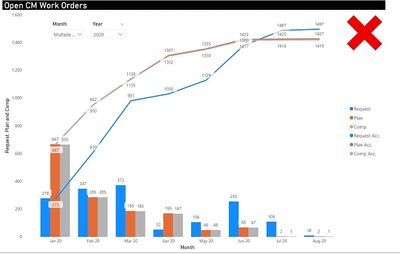
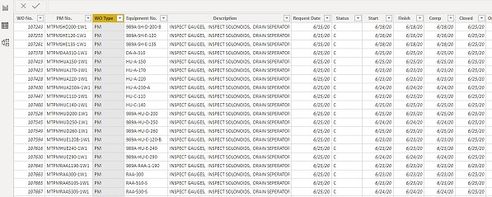
I am very new to power BI and have taught myself most everything I know by searching the internet but I have come across something I apparently do not understand because I have tried repeatedly to make this work. I have data from a work order system that has Request date, Start, Finish, Comp, and Closed dates. I have been requested to put the data in the format of the visual below. There are many types of work and this needs to be just the CM work type. In order to make this I have a Date table and have copied the table displayed 3 times and made relationships to each of the dates. Request Date, Start, Comp. I then am counting the dates and filtering the page to just CM work type but the data that is displayed is simply not correct. I very much would like to be ask anyone if they can help me out with this issue. Capture3.JPG


Capture.JPG


Capture2.JPG


0 REPLIES 0

Helpful resources

Announcements
FabCon and SQLCon Barcelona 2026

FabCon & SQLCon – Barcelona 2026

Join us in Barcelona for FabCon and SQLCon, the Fabric, Power BI, SQL, and AI community event. Save €200 with code FABCMTY200.

60 days of Data Days Carousel

Data Days 2026

Join Data Days 2026: 60 days of free live/on-demand sessions, challenges, study groups, and certification opportunities.

Power BI DataViz World Championships carousel

Power BI DataViz World Championships - June 2026

A new Power BI DataViz World Championship is coming this June! Don't miss out on submitting your entry.

Top Solution Authors