This is best Fabric, Power BI, SQL and AI community event. How do we know? The last event sold out! Save €200 with code FABCMTY200.
Register nowThe Fabric community is now in read-only for platform upgrade. Learn more
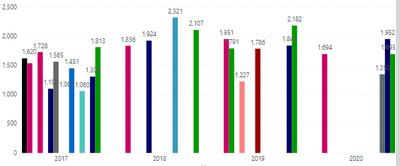
Hi, I'm new in power BI. I had problem to visualize my data using bar chart with the value using sumproduct value. My goal is to create chart like this
Using below data:
| Size | Thickness | Type | Date | Company | TONS | USD | USD/TONS | |
| 5 | 10 | A | 1-Jan-20 | X | 10 | 1000 | 100 | |
| 5 | 20 | B | 5-Feb-20 | X | 20 | 3000 | 150 | |
| 5 | 10 | A | 1-Jan-20 | Y | 10 | 1000 | 100 | |
| 5 | 20 | B | 5-Feb-20 | Y | 20 | 3000 | 150 | |
| 10 | 10 | A | 18-Jan-20 | X | 10 | 2000 | 200 | |
| 10 | 10 | A | 18-Jan-20 | Y | 10 | 4000 | 400 | |
| 10 | 20 | B | 28-Mar-20 | X | 20 | 2000 | 100 | |
| 10 | 20 | B | 28-Mar-20 | Y | 20 | 4000 | 200 | |
| 10 | 30 | C | 30-May-20 | X | 20 | 6000 | 300 | |
| 10 | 30 | C | 30-May-20 | Y | 20 | 4000 | 200 | |
| 1 | 10 | A | 9-Apr-20 | X | 20 | 10000 | 500 | |
| 1 | 10 | A | 9-Apr-20 | Y | 20 | 20000 | 1000 |
My only concern is how to put the value in chart using SUMPRODUCT value on above data on the USD/TONS.
Thank you,
Regards,
Danang
Join us in Barcelona for FabCon and SQLCon, the Fabric, Power BI, SQL, and AI community event. Save €200 with code FABCMTY200.