This is best Fabric, Power BI, SQL and AI community event. How do we know? The last event sold out! Save €200 with code FABCMTY200.
Register nowThe Fabric community is upgrading! Read all of the details including the timeline and what you can expect. Learn more
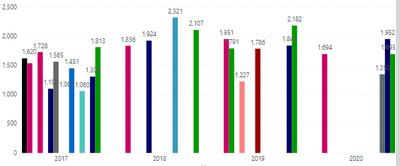
Hi, I'm new in power BI. I had problem to visualize my data using bar chart with the value using sumproduct value. My goal is to create chart like this
Using below data:
| Size | Thickness | Type | Date | Company | TONS | USD | USD/TONS | |
| 5 | 10 | A | 1-Jan-20 | X | 10 | 1000 | 100 | |
| 5 | 20 | B | 5-Feb-20 | X | 20 | 3000 | 150 | |
| 5 | 10 | A | 1-Jan-20 | Y | 10 | 1000 | 100 | |
| 5 | 20 | B | 5-Feb-20 | Y | 20 | 3000 | 150 | |
| 10 | 10 | A | 18-Jan-20 | X | 10 | 2000 | 200 | |
| 10 | 10 | A | 18-Jan-20 | Y | 10 | 4000 | 400 | |
| 10 | 20 | B | 28-Mar-20 | X | 20 | 2000 | 100 | |
| 10 | 20 | B | 28-Mar-20 | Y | 20 | 4000 | 200 | |
| 10 | 30 | C | 30-May-20 | X | 20 | 6000 | 300 | |
| 10 | 30 | C | 30-May-20 | Y | 20 | 4000 | 200 | |
| 1 | 10 | A | 9-Apr-20 | X | 20 | 10000 | 500 | |
| 1 | 10 | A | 9-Apr-20 | Y | 20 | 20000 | 1000 |
My only concern is how to put the value in chart using SUMPRODUCT value on above data on the USD/TONS.
Thank you,
Regards,
Danang
which values are you trying to multiply? Your sample data doesn't match the chart, so it is difficult to see that.
Join us in Barcelona for FabCon and SQLCon, the Fabric, Power BI, SQL, and AI community event. Save €200 with code FABCMTY200.