FabCon is coming to Atlanta
Join us at FabCon Atlanta from March 16 - 20, 2026, for the ultimate Fabric, Power BI, AI and SQL community-led event. Save $200 with code FABCOMM.
Register now!- Power BI forums
- Get Help with Power BI
- Desktop
- Service
- Report Server
- Power Query
- Mobile Apps
- Developer
- DAX Commands and Tips
- Custom Visuals Development Discussion
- Health and Life Sciences
- Power BI Spanish forums
- Translated Spanish Desktop
- Training and Consulting
- Instructor Led Training
- Dashboard in a Day for Women, by Women
- Galleries
- Data Stories Gallery
- Themes Gallery
- Contests Gallery
- QuickViz Gallery
- Quick Measures Gallery
- Visual Calculations Gallery
- Notebook Gallery
- Translytical Task Flow Gallery
- TMDL Gallery
- R Script Showcase
- Webinars and Video Gallery
- Ideas
- Custom Visuals Ideas (read-only)
- Issues
- Issues
- Events
- Upcoming Events
The Power BI Data Visualization World Championships is back! It's time to submit your entry. Live now!
- Power BI forums
- Forums
- Get Help with Power BI
- Custom Visuals Development Discussion
- Disable table visualization's order
- Subscribe to RSS Feed
- Mark Topic as New
- Mark Topic as Read
- Float this Topic for Current User
- Bookmark
- Subscribe
- Printer Friendly Page
- Mark as New
- Bookmark
- Subscribe
- Mute
- Subscribe to RSS Feed
- Permalink
- Report Inappropriate Content
Disable table visualization's order
hi, i have an excel table like this:
Metrics Figures
Loan 12
Provision 3
Write-offs 1.5
Net losses 2
I want my table visual to look exactly the same as in the above table. However, PB automatically sort the table based on the Metrics column. The output looks like this:
Metrics Figures
Loan ...
Net losses ...
Provision ...
Write-offs ...
How may I fix this issue? Thank you in advance!
- Mark as New
- Bookmark
- Subscribe
- Mute
- Subscribe to RSS Feed
- Permalink
- Report Inappropriate Content
Hi @khue98
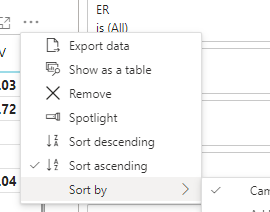
In the top right corner of the visual in the ... options is where the default sort order can be set. There is the option to base the sorting on the dimension or the measure.
Please note your metrics are conveniently sorted A-Z. If you want to change to non-A-Z order you need to add a Sort Key and then set the "Sort by Column" option. Sort one column by another column in Power BI - Power BI | Microsoft Docs
Helpful resources

Power BI Dataviz World Championships
The Power BI Data Visualization World Championships is back! It's time to submit your entry.

Power BI Monthly Update - January 2026
Check out the January 2026 Power BI update to learn about new features.


