cancel
Showing results for 
Search instead for 
Did you mean: 

July 7 - July 17 | Round 2 of the Power BI Dataviz World Championships. Don't miss your chance! Learn more

Reply
DKDBA
Frequent Visitor

Combo chart

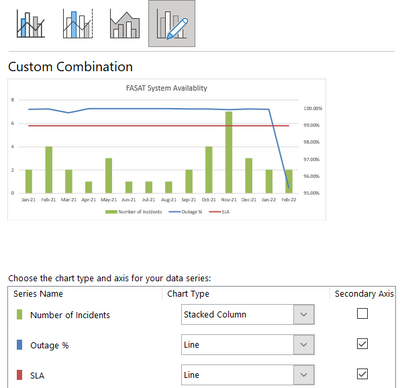
I am trying to replicate Excel report in Power BI and there is a a Combo chart with columns and two lines. I tried using line and clustered column visual in Power BI, but I am able to add only one line, not two. Is there any way to add multiple lines to the combo chart?

DKDBA_0-1653746301695.png


1 ACCEPTED SOLUTION
AlexisOlson
Super User
Super User

I'm not sure where you're running into trouble. You can definitely add multiple fields to the Line y-axis box.


AlexisOlson_0-1653771157456.png

View solution in original post

4 REPLIES 4
DKDBA
Frequent Visitor

Thank you very much! It worked, sorry for the delay in my reply. 

AlexisOlson
Super User
Super User

I'm not sure where you're running into trouble. You can definitely add multiple fields to the Line y-axis box.


AlexisOlson_0-1653771157456.png

Curious why when switching from a 'Clustered Column' (values by all months and several years) to 'Line and Clustered Column' (drag the values field from Column Y-Axis into the Line Y-Axis), PBI adds together the values for all months and omits years?... calculation is set to 'no calculation' on the 'show value as'... really a strange thing that I can't get to resolve.  Maybe because there's not a 'Line Y-Axis Legend' to drag years into... IDK.


Interestingly, when I drag the values field into the 'Small Multiples' field, the engine correctly infers year context, but unfortunately breaks each year into a separate mini-chart for each year.


If I switch to the chart type of 'Line Chart', the correct context is rendered there, too... but just need to get the column component, like in Excel with the 'Combo Chart' option (tangent/venting:  the PBI team should have Combo Chart in this software, IMO... MS Office products should leverage continuity between apps whenever possible, especially from Excel into PBI).

For what it's worth, I believe the issue with not having multiple lines work automatically is that there isn't a 'Line Legend', but there is for columns.  So it appears if you want separate lines for each year, you have to write a different formula filtering for each year.

Excel is so much more customizable.

Helpful resources

Announcements
FabCon and SQLCon Barcelona 2026

FabCon & SQLCon – Barcelona 2026

Join us in Barcelona for FabCon and SQLCon, the Fabric, Power BI, SQL, and AI community event. Save €200 with code FABCMTY200.

60 days of Data Days Carousel

Data Days 2026

Join Data Days 2026: 60 days of free live/on-demand sessions, challenges, study groups, and certification opportunities.

Power BI DataViz World Championships carousel

Power BI DataViz World Championships - June 2026

A new Power BI DataViz World Championship is coming this June! Don't miss out on submitting your entry.

Top Solution Authors