Get certified for free when you join Fabric Data Days 2026 and dive into Fabric, Power BI, SQL, AI, and other essential data skills.
Join nowJuly 7 - July 17 | Round 2 of the Power BI Dataviz World Championships. Don't miss your chance! Learn more
When using the web interface (app.powerbi.com) to look at my datasets, I can only see how to make reports from my datasets. I want to view the data in the dataset as a table view (like Excel sort of view) so I know what data is in there and can therefore better understand what sort of reports I can make from it. Seems like I must be missing something obvious but I can't seem to find out how to get this view.
Solved! Go to Solution.
Probably not missing anything, that doesn't exist as nice as it does in Power BI Desktop. So, couple options, one, import the data into Power BI Desktop and look at it there. Two, create a table visualization in Service and add all of your columns to it.
@Greg_Deckler is correct. Those are currently the best two alternatives. If you want a data view in the service as well, you can suggest it on our ideas forum at ideas.powerbi.com
Probably not missing anything, that doesn't exist as nice as it does in Power BI Desktop. So, couple options, one, import the data into Power BI Desktop and look at it there. Two, create a table visualization in Service and add all of your columns to it.
Hi @Greg_Deckler,
Pardon my silly question.
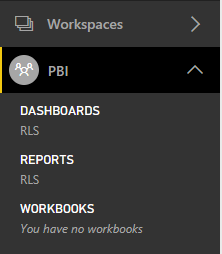
The client has granted me access to one of the work spaces and this has got me confused!!! As I do not have Office 365 Admin / PBI Service Admin credentials, I m unable to verify this aspect. Is it even possible to include only Dashboard and Reports without including Dataset? This is in PROD work space. On Dev and QA I can view the data sets.
I always thought that it wasn't possible to hide the datasets in Workspace or in Apps ?
Join us in Barcelona for FabCon and SQLCon, the Fabric, Power BI, SQL, and AI community event. Save €200 with code FABCMTY200.
Join Fabric Data Days 2026: 60 days of free live/on-demand sessions, challenges, study groups, and certification opportunities.
| User | Count |
|---|---|
| 18 | |
| 12 | |
| 9 | |
| 8 | |
| 5 |
| User | Count |
|---|---|
| 30 | |
| 28 | |
| 25 | |
| 24 | |
| 24 |